How to use the CDP Output Viewer
In this guide, we will cover:
The basic framework of the ESGF Output Viewer, consisting of indices, pages, groups, rows, and columns.
The process of using the CDP Output Viewer (
cdp_viewer), including explanations and examples related to the relevant functions.CDP Output Viewer is based on the ESGF Output Viewer
The Output Viewer Framework
The Output Viewer is a framework that allows for the visualization of files. These files include output images from diagnostics, scripts used to run diagnostics, etc. It also provides a way to create an HTML file to easily view the results.
Below is an example of a webpage created with the Output Viewer:
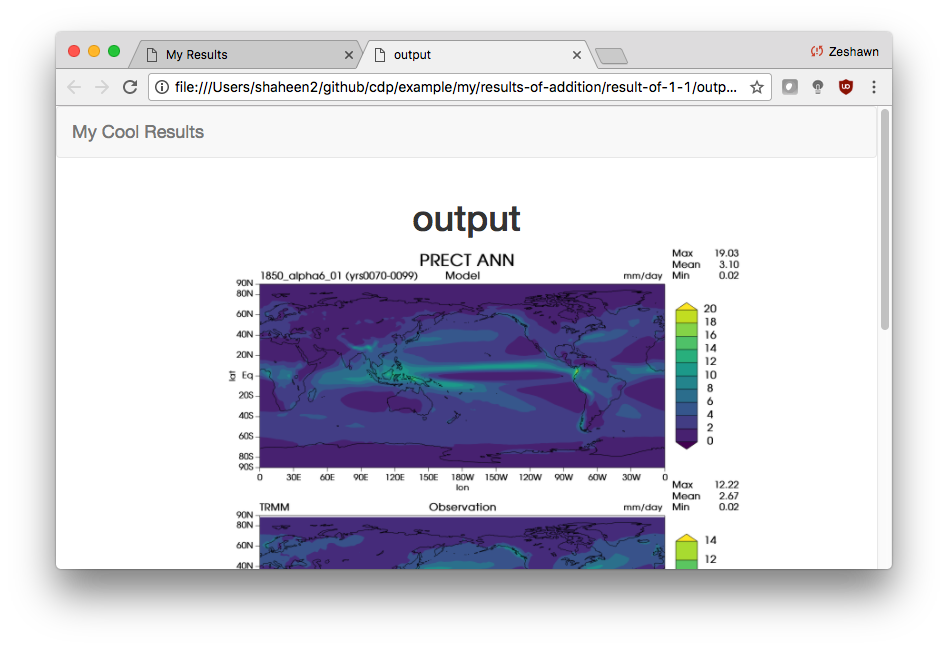
Figure 1: An example of a webpage generated by the Output Viewer.
The Output Viewer framework consists of five base components that are required for a working viewer: indices, pages, groups, rows, and columns.
1. Indices
An index is what you see when you first go on the HTML page created from the Output Viewer.
An index is consists of one or more pages. The index name is what appears on the top left hand corner.
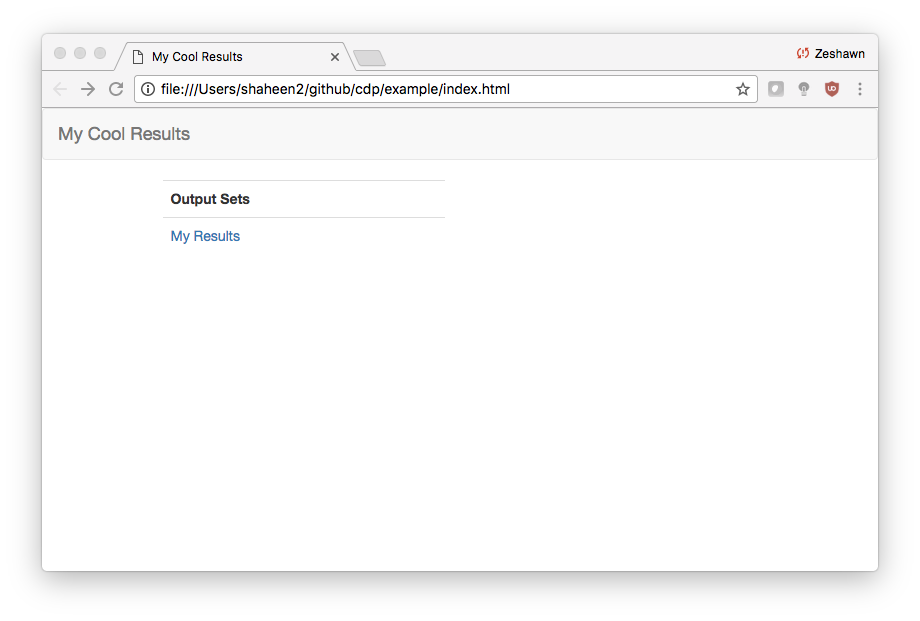
Figure 2: The index is the first page one sees. All of the links below ‘Output Sets’ are individual pages.
2. Pages
Pages are where the user can view the output. A page consists of at least one group.
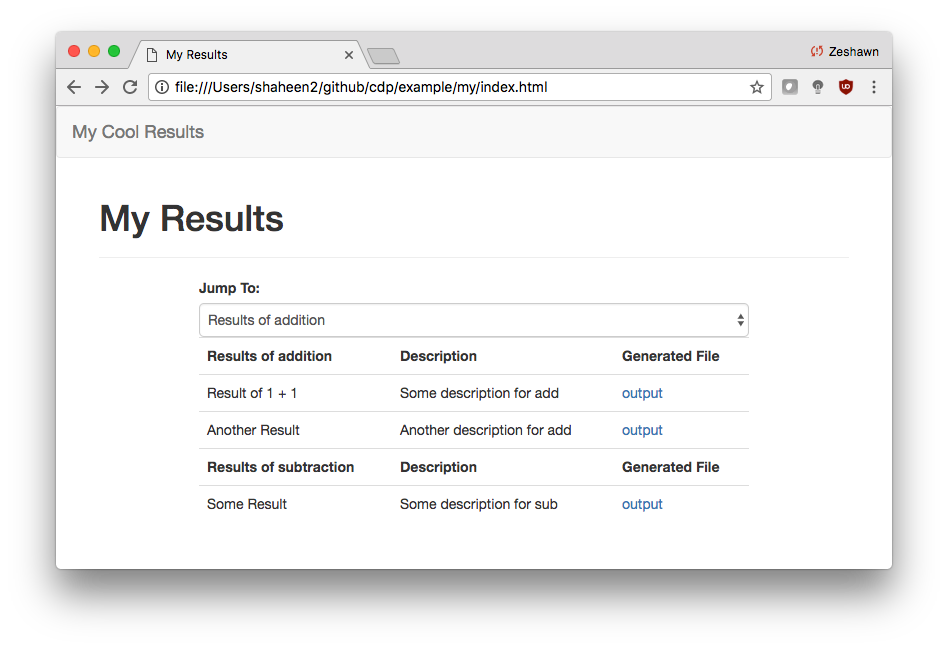
Figure 3: A page with two groups: ‘Results of addition’ and ‘Results of subtraction’.
The Jump To form item is used to jump between groups for really long pages.
3. Groups
A group consists of one or more rows.
In Figure 3 above, we see that the page has two groups.
4. Rows
A row consists of one or more columns. Each row must have at least one column, which represents the name.
The first group in Figure 3 has two rows, while the second group has a single row. All rows in the figure have three columns.
5. Columns
Columns are the most granular component of the viewer.
You can add columns that are strings or files, like the Description and Generated File columns respectively.
Summary
To create a viewer with the Output Viewer:
Have at least one index
An index must have at least one page
A page must have at least one group
A group must have at least one row
A row must have at least one column
Using CDP Output Viewer (cdp_viewer)
cdp_viewer is a wrapper of the Output Viewer to simplify the API for creating a working viewer.
If cdp_viewer is too abstract/limited, you can instead use the Output Viewer to create your own viewer. Please be aware that there is no official documentation for the Output Viewer, so you will need refer to the codebase directly.
The code below was used to create the figures above.
Note
If you plan on running this example code, you’ll need a file titled output.png in your current directory.
from cdp.cdp_viewer import OutputViewer

viewer = OutputViewer(index_name='My Cool Results')
viewer.add_page("My Results", ['Description', 'Generated File'])

viewer.add_group('Results of addition')
viewer.add_row('Result of 1 + 1')
viewer.add_col('Some description for add')
viewer.add_col('output.png', is_file=True)
viewer.add_row('Another Result')
viewer.add_col('Another description for add')
viewer.add_col('output.png', is_file=True)

viewer.add_group('Results of subtraction')
viewer.add_row('Some Result')
viewer.add_col('Some description for sub')
viewer.add_col('output.png', is_file=True)

viewer.generate_viewer()
Viewer HTML generated at /Users/shaheen2/github/cdp/jupyter/index.html. Would you like to open in a browser? y/[n]: y
Functions of cdp_viewer
The cdp_viewer five functions:
add_page(name, columns)- Add a page to the viewer’s indexname(str) - the page’s titlecolumns(List[str]) - list of strings for each column that will appear on the page. These columns will be the same for every group/row on the page
add_group(group_name)- Add a group to the page that was added viaadd_page()group_name(str) - name of the group
add_row(name)- Add a row to the group that was added viaadd_group()name(str) - name of the row
add_col(col, is_file=False, **kwargs)- Add a col to the current row, which was added viaadd_row()col(str) - col valueis_file(bool) - ifTrue, then anOutputFilewill be created with**kwargs**kwargs- See the Output Viewer API for more details about thekwargsvalues that can be passed in
generate_viewer()- Generate the webpage and notify the user if they want to view itNote that the functions must be called in the order shown in the example
For example, calling
add_group()will add a group to the last page that was called viaadd_page()