Colormaps
A few words about colormaps. We tried to select default colormaps that were both aesthetically pleasing and would help better visualize the data. In the process of identifying suitable colormaps, we quickly realized that no single colormap would do the job. So we settled on a few different combinations depending on variables being plotted.
Default
The default colormaps consist of the perceptually uniform rainbow from the colorcet collection for the top two panels. For the difference panel, a custom diverging colormap was built that smoothly transitions from the blue to the red ends of the rainbow. The center of the colormap is white to avoid distracting the eye with from small variations around zero.
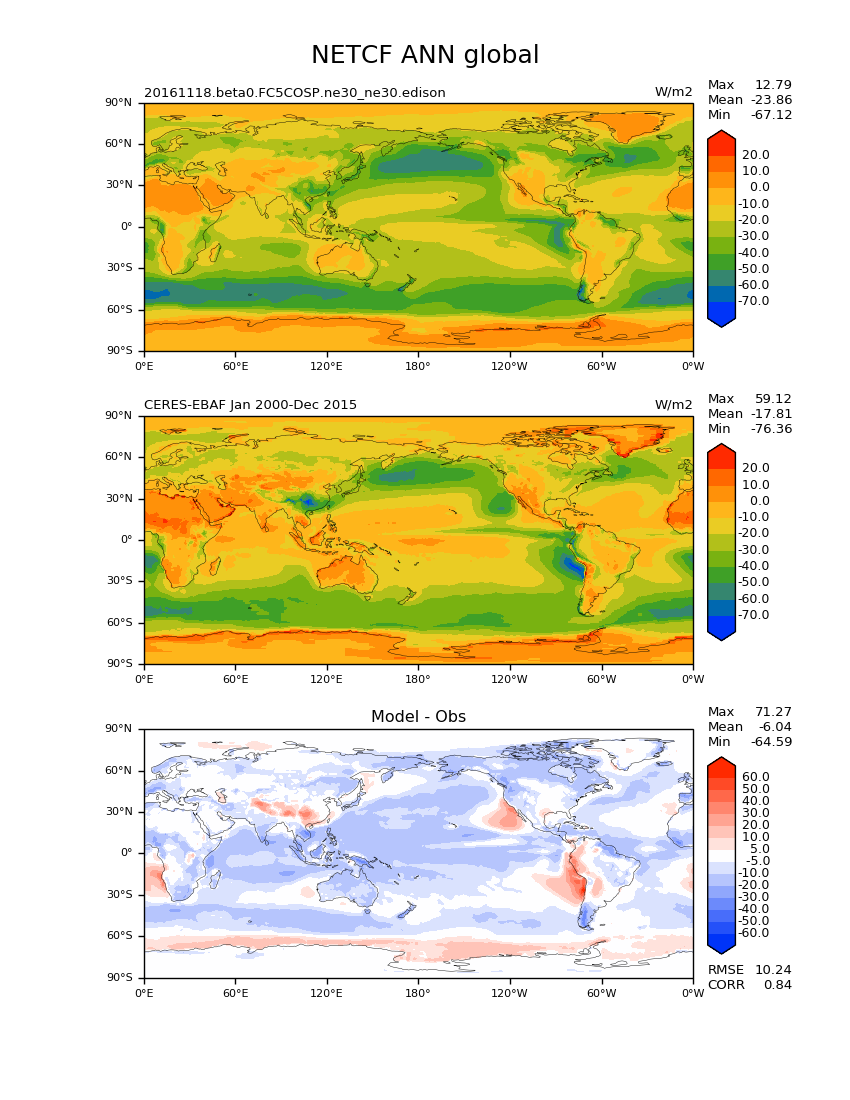
Illustration of default colormaps for annual net TOA cloud forcing.
Precipitation
For precipitation, we selected alternate colormaps. Precipitation in the top two panels is displayed using the NCL WhiteBlueGreenYellowRed colormap as suggested by Walter Hannah. The difference in the bottom panel is plotted with the Matplotlib diverging colormap BrBG to highlight excessively dry (brown) and wet areas (green).
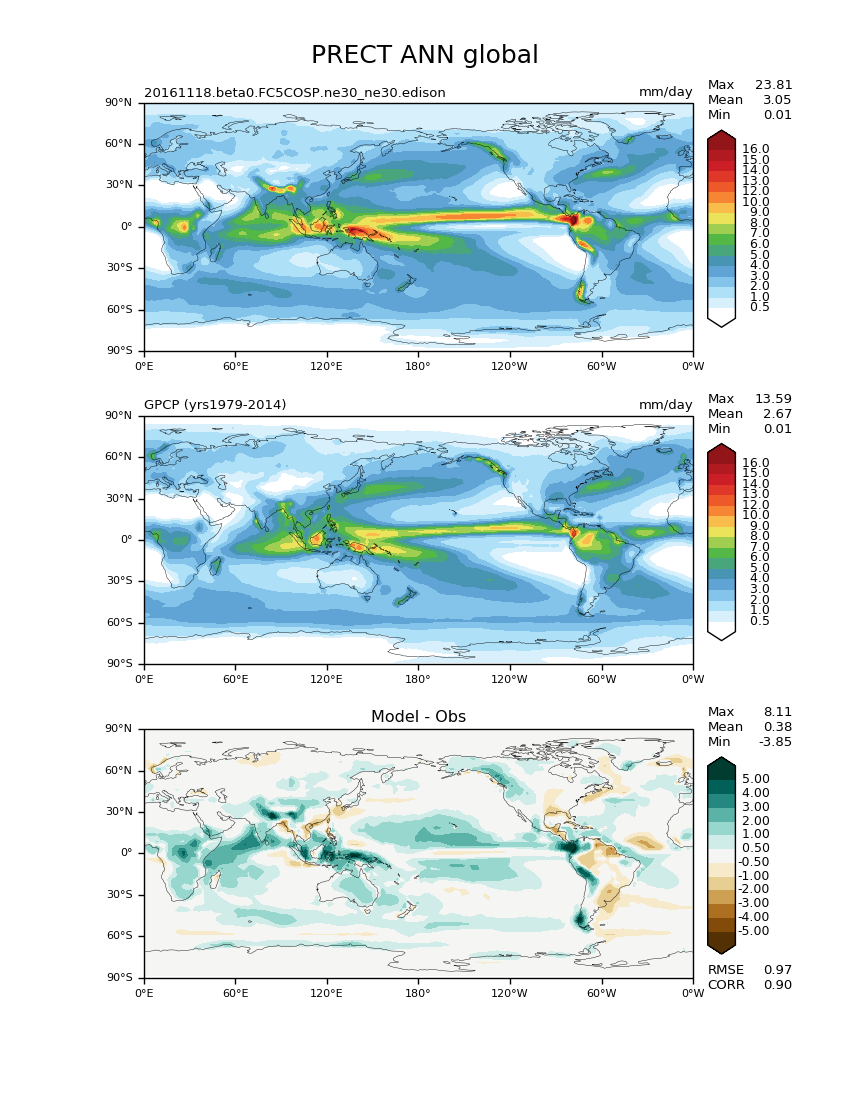
Default colormaps for precipitation.
Wind
Wind (u, omega) is yet another special case. To clearly mark the difference between easterly/westerly or up/down motions, we decided that a diverging colormap would be best. We selected PiYG_r from Matplotlib for the wind field and paired it with a diverging colormap from colorcet (diverging_bwr).
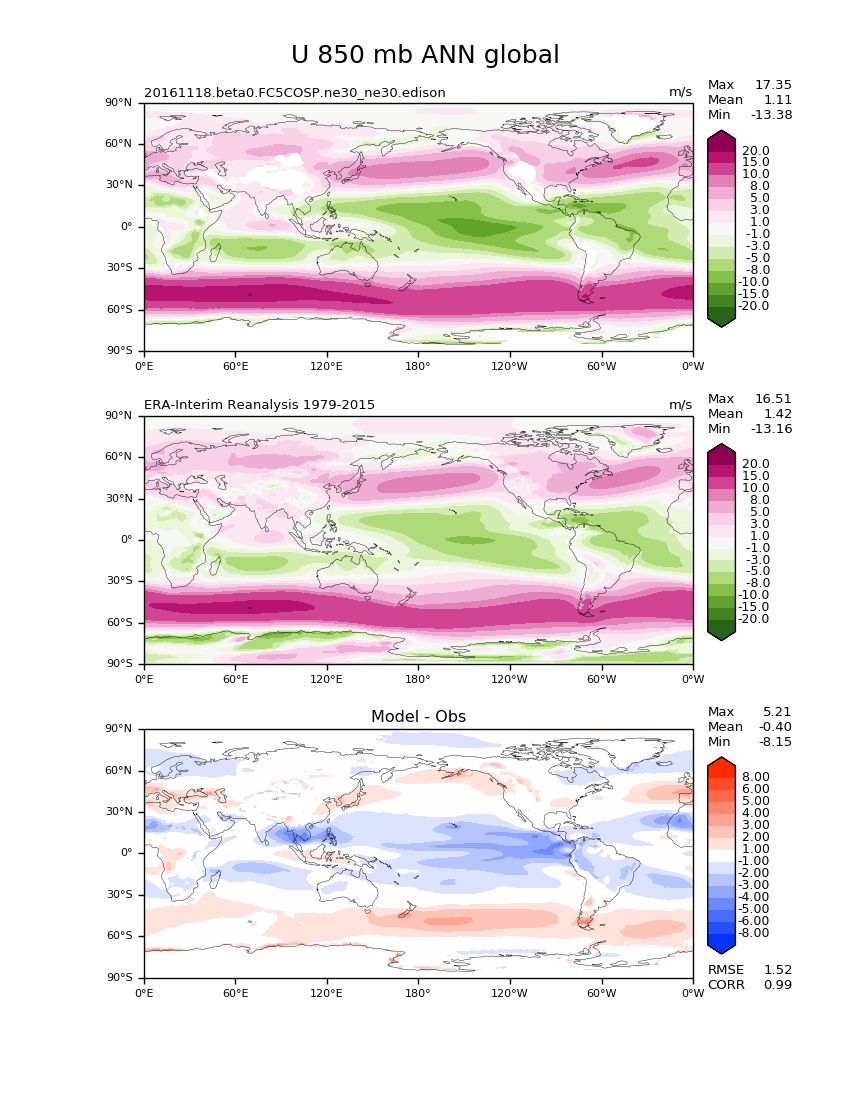
Default colormaps for wind.
Customizing
Because we realize that selecting a good colormap is rather subjective and there is probably (?) no perfect solution, we also made it easy to customize colormap choices. Colormaps for each panel can be specified using the following parameters (see also defining parameters):
test_colormap for the top panel.
reference_colormap for the middle panel.
diff_colormap for the bottom one.
Colormaps can be specified by either using a standard Matplotlib map name or an external rgb ascii file. All colormaps from the colorcet collection have been imported as rgb files by Charles Doutriaux (available under e3sm_diags/plot/colormaps).
You can also import your very own colormap by creating and specifying the path to an ascii rgb file containing a list of colors in RGB space. If you think you have something that improves upon the current default, please send some samples to Jill (zhang40 .at. llnl.gov) or Zeshawn (shaheen2 .at. llnl.gov) and we will consider them from inclusion in a future release.