E3SM Diagnostics Package v2
Welcome to the E3SM Diagnostics Package documentation hub.
To change the documentation version, use the version selector in the bottom left-hand corner.
Please note, documentation for versions v2.5.0 are not available in the version selector.
Warning
As of v2.6.0, e3sm_diags should be used as the module name instead of
acme_diags. Instances of acme_diags in the Python import statements should
be replaced accordingly.
Contents:
- E3SM Diagnostics Package v2
- Input Data Requirement
- Quick Guides
- General quick guide for running e3sm_diags v2
- Acme1 quick guide for running e3sm_diags v2
- Anvil quick guide for running e3sm_diags v2
- Chrysalis quick guide for running e3sm_diags v2
- Compy quick guide for running e3sm_diags v2
- Cori-Haswell quick guide for running e3sm_diags v2
- Old Quick Guides for v1
- Examples
- Installation
- Configuration and Running
- Defining Parameters
- Available Parameters
- Colormaps
- How to Add New Diagnostics Runs
- Developer Guide
- Contributing to E3SM Diags
Overview
This diagnostics package is constructed to support the diagnostics needs of DOE’s Energy Exascale Earth System Model (E3SM) project, formerly known as Accelerated Climate Modeling for Energy (ACME). The ultimate goal of this work is to develop a comprehensive diagnostics package that:
integrates the basic functionality of NCAR’s AMWG diagnostics package;
utilizes most updated observational datasets, including remote sensing, reanalysis and in-situ datasets;
interfaces with diagnostics developed from different E3SM focus groups: atmosphere group, coupled simulation group, land group;
interacts effectively with the PCMDI’s metrics package and the ARM diagnostics package through a unifying framework: Community Diagnostics Package (CDP).
is flexible for user-specified diagnostics and configuration for use by other climate models.
Current State (v2 release)
Algorithm and visualization codes for latitude-longitude contour maps, polar contour maps, the accompanying summarizing table and Taylor diagram plots, pressure-latitude zonal mean contour plots, zonal mean line plots, pressure-longitude meridional mean contour plots, area mean time series plots, and Cloud Top Height-Tau joint histograms from COSP cloud simulator output. Plots can be created for annual and seasonal climatologies, and monthly mean time series. In additional to the core sets being released in v1, ENSO diags, QBO diags, Diurnal cycle phase plot, Streamflow evaluation, ARM diags, and TC analysis are implemented in v2 release.
The package also supports custom user diagnostics, by specifying plot type, desired region (global, ocean, land, etc.), pressure levels for variables with the vertical dimension.
For flexibility, the code structure cleanly separates data manipulation (reading input files, processing data, etc) from plotting functions. One back-end is available:
matplotlib/ cartopy (mpl)
Additional back-ends could be implemented if the need arose.
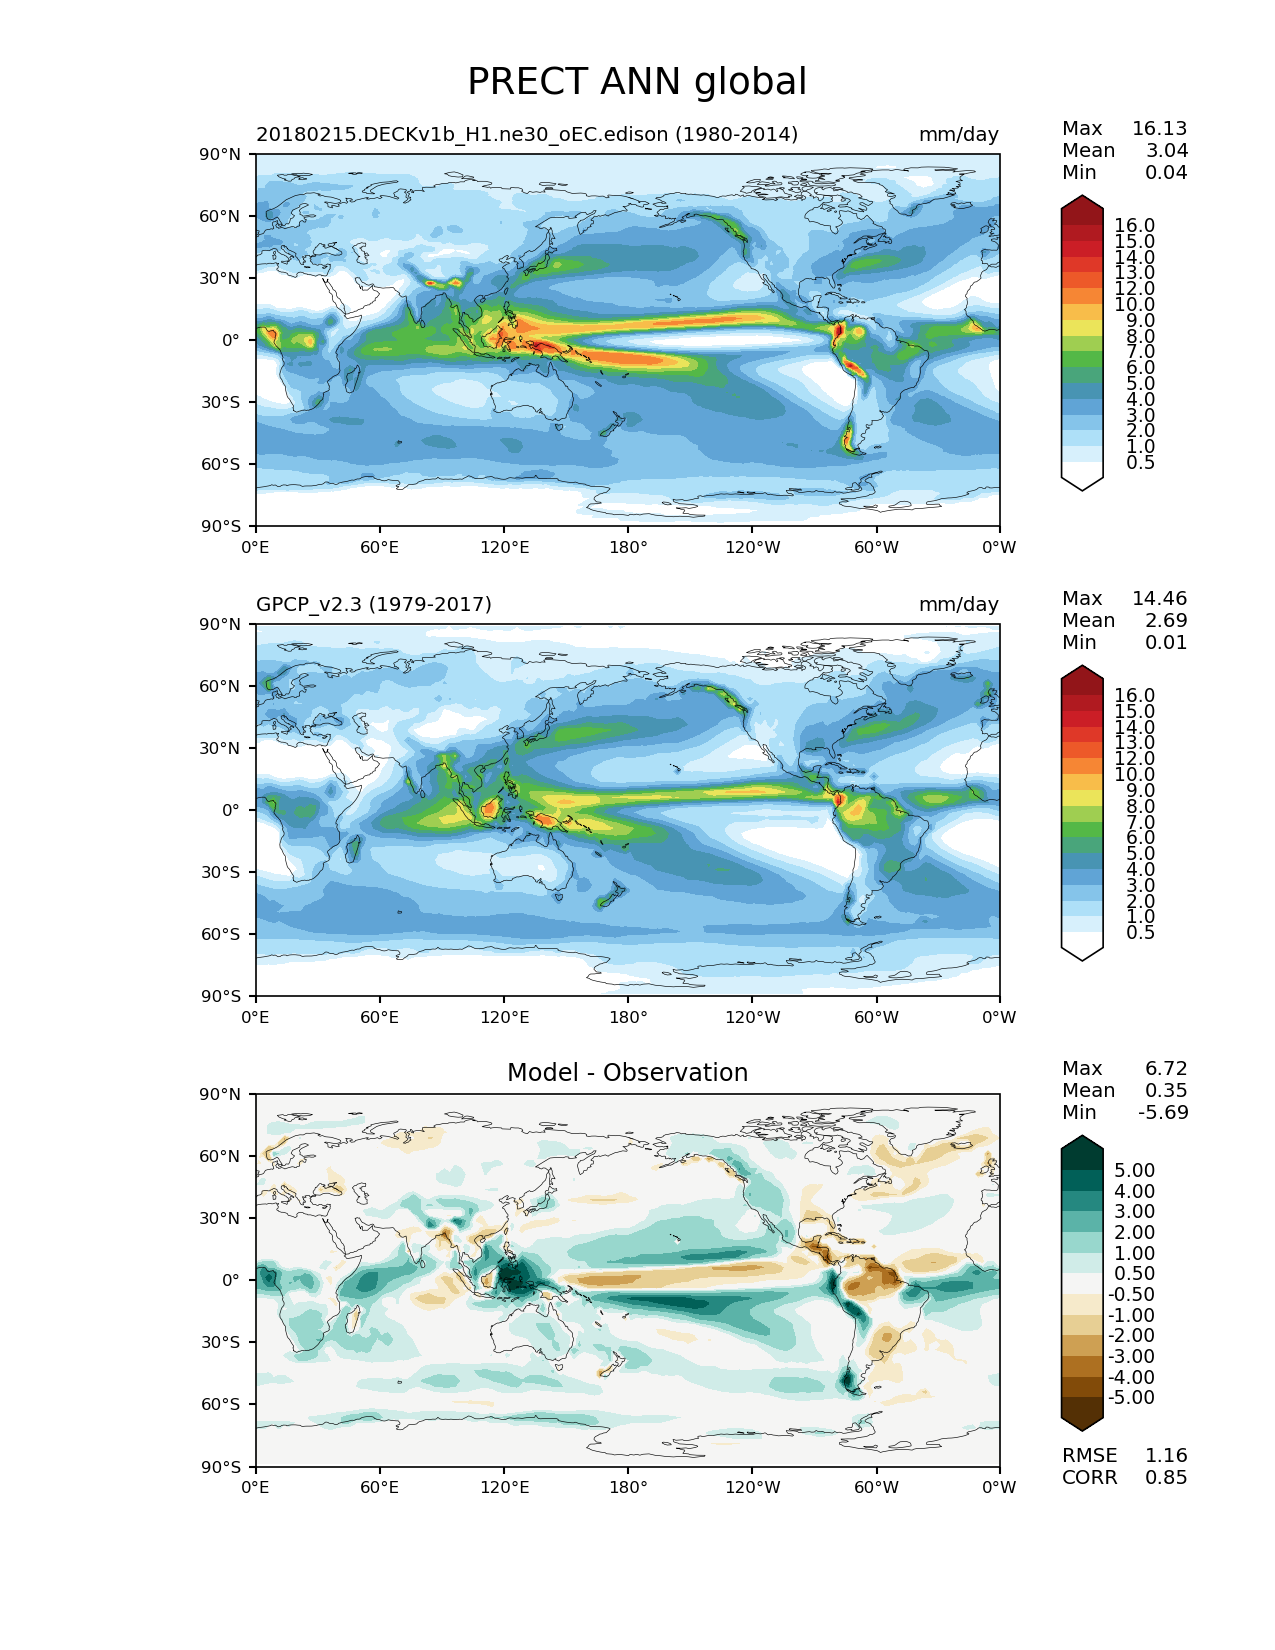
Latitude-longitude contour map |
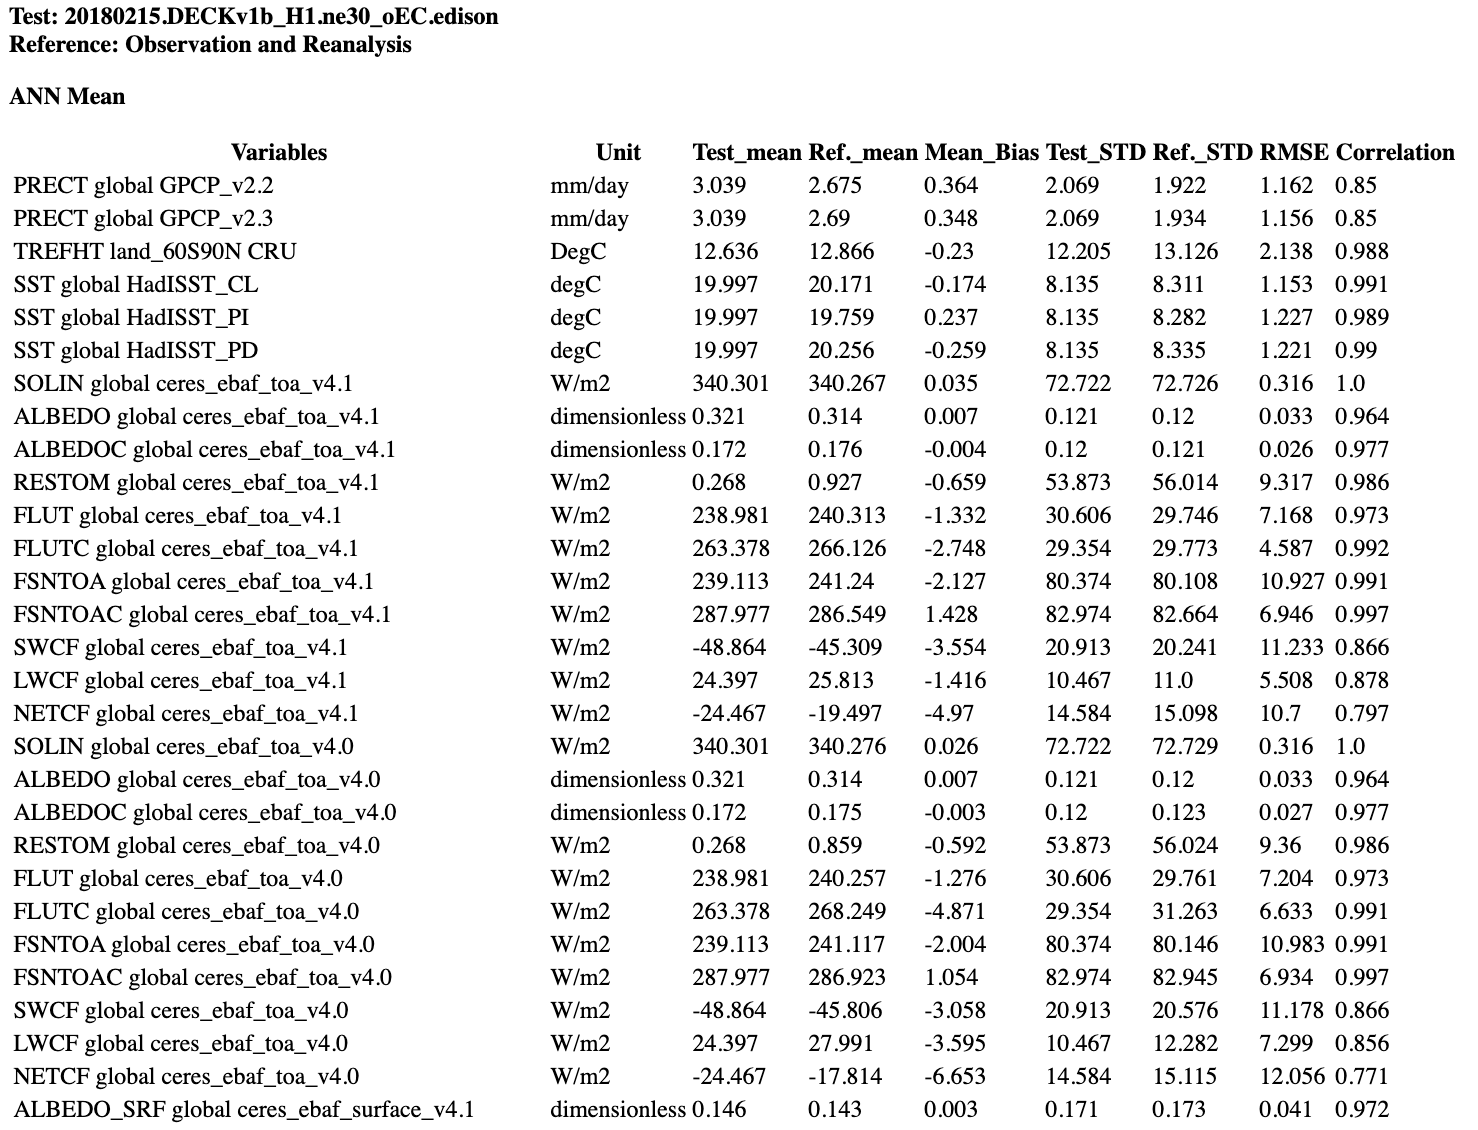
Summary table |
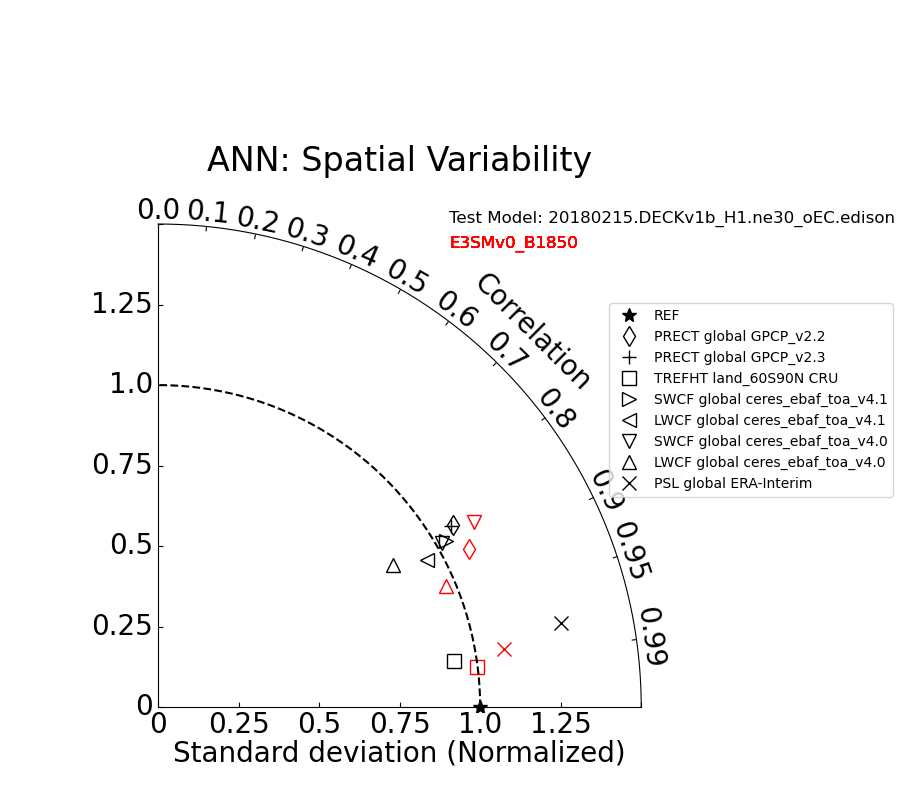
Taylor Diagram |
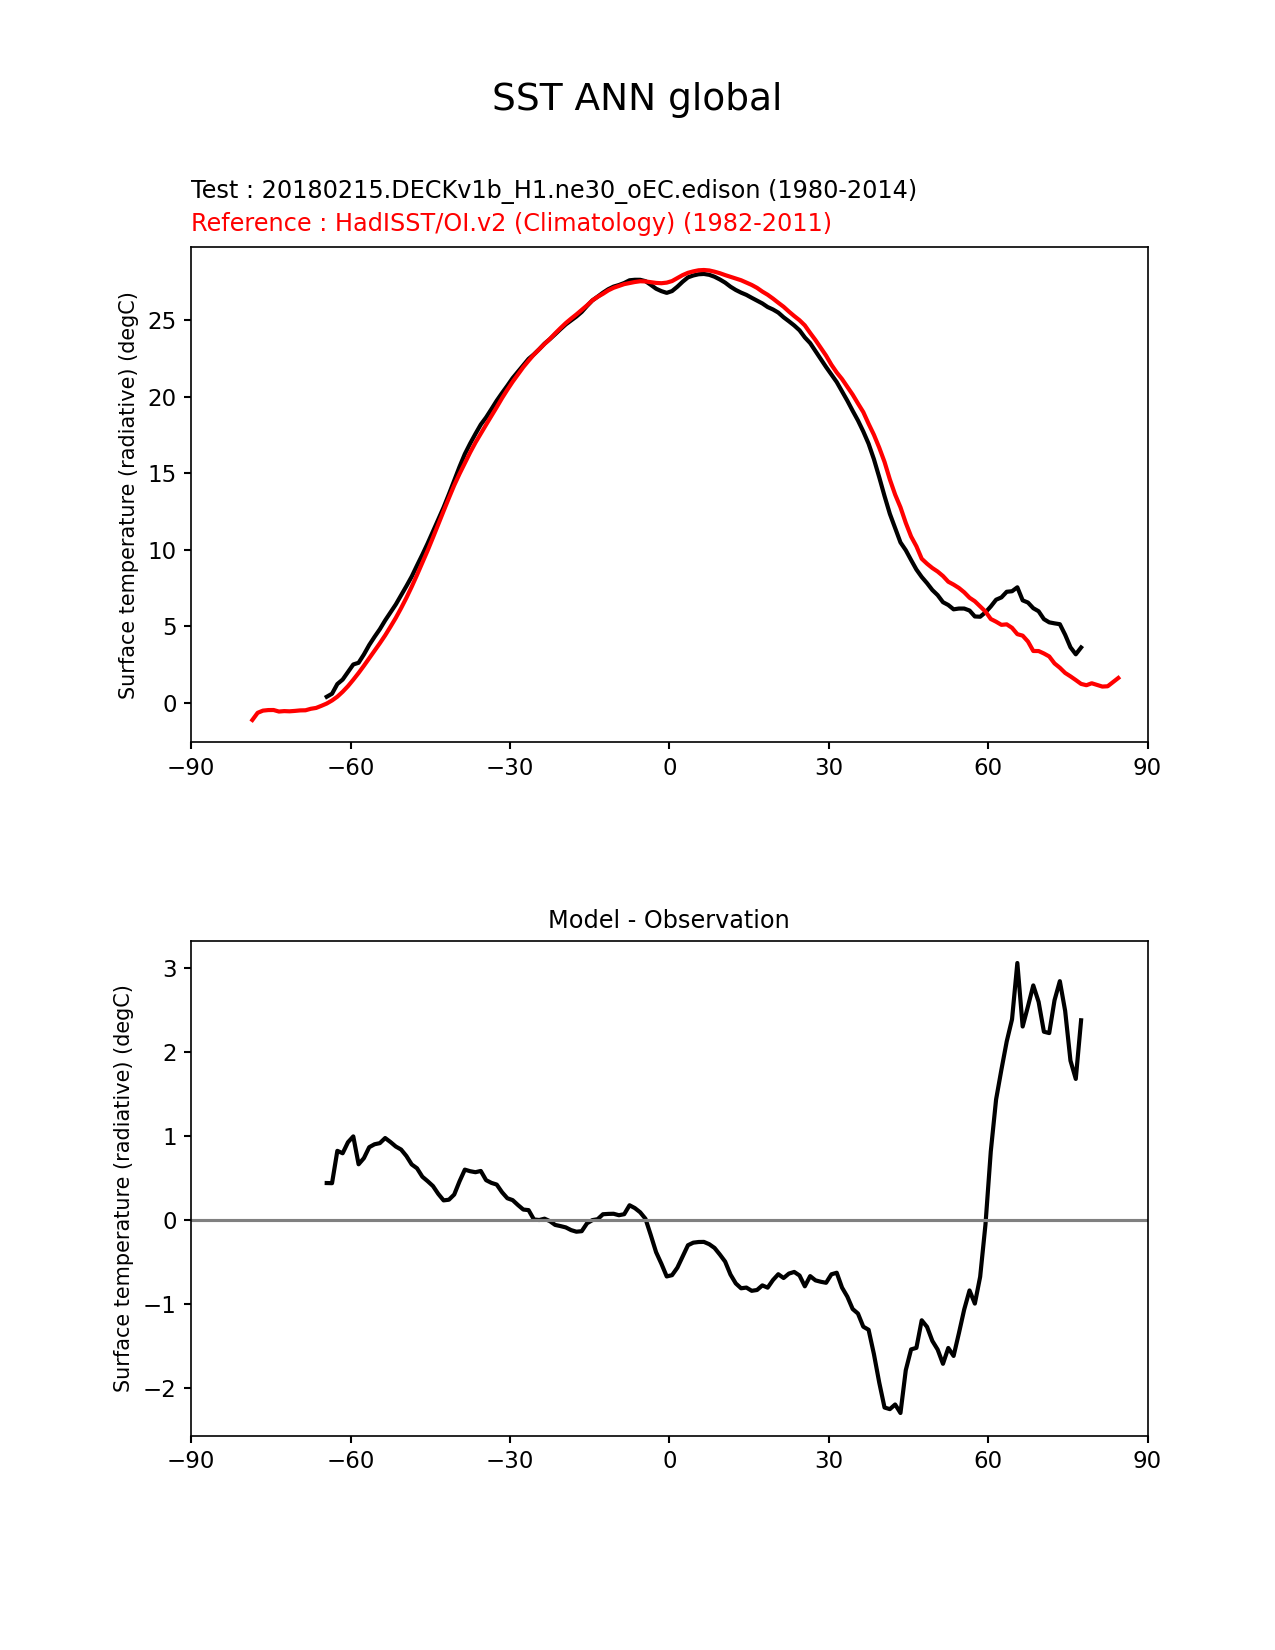
Zonal mean line plot |
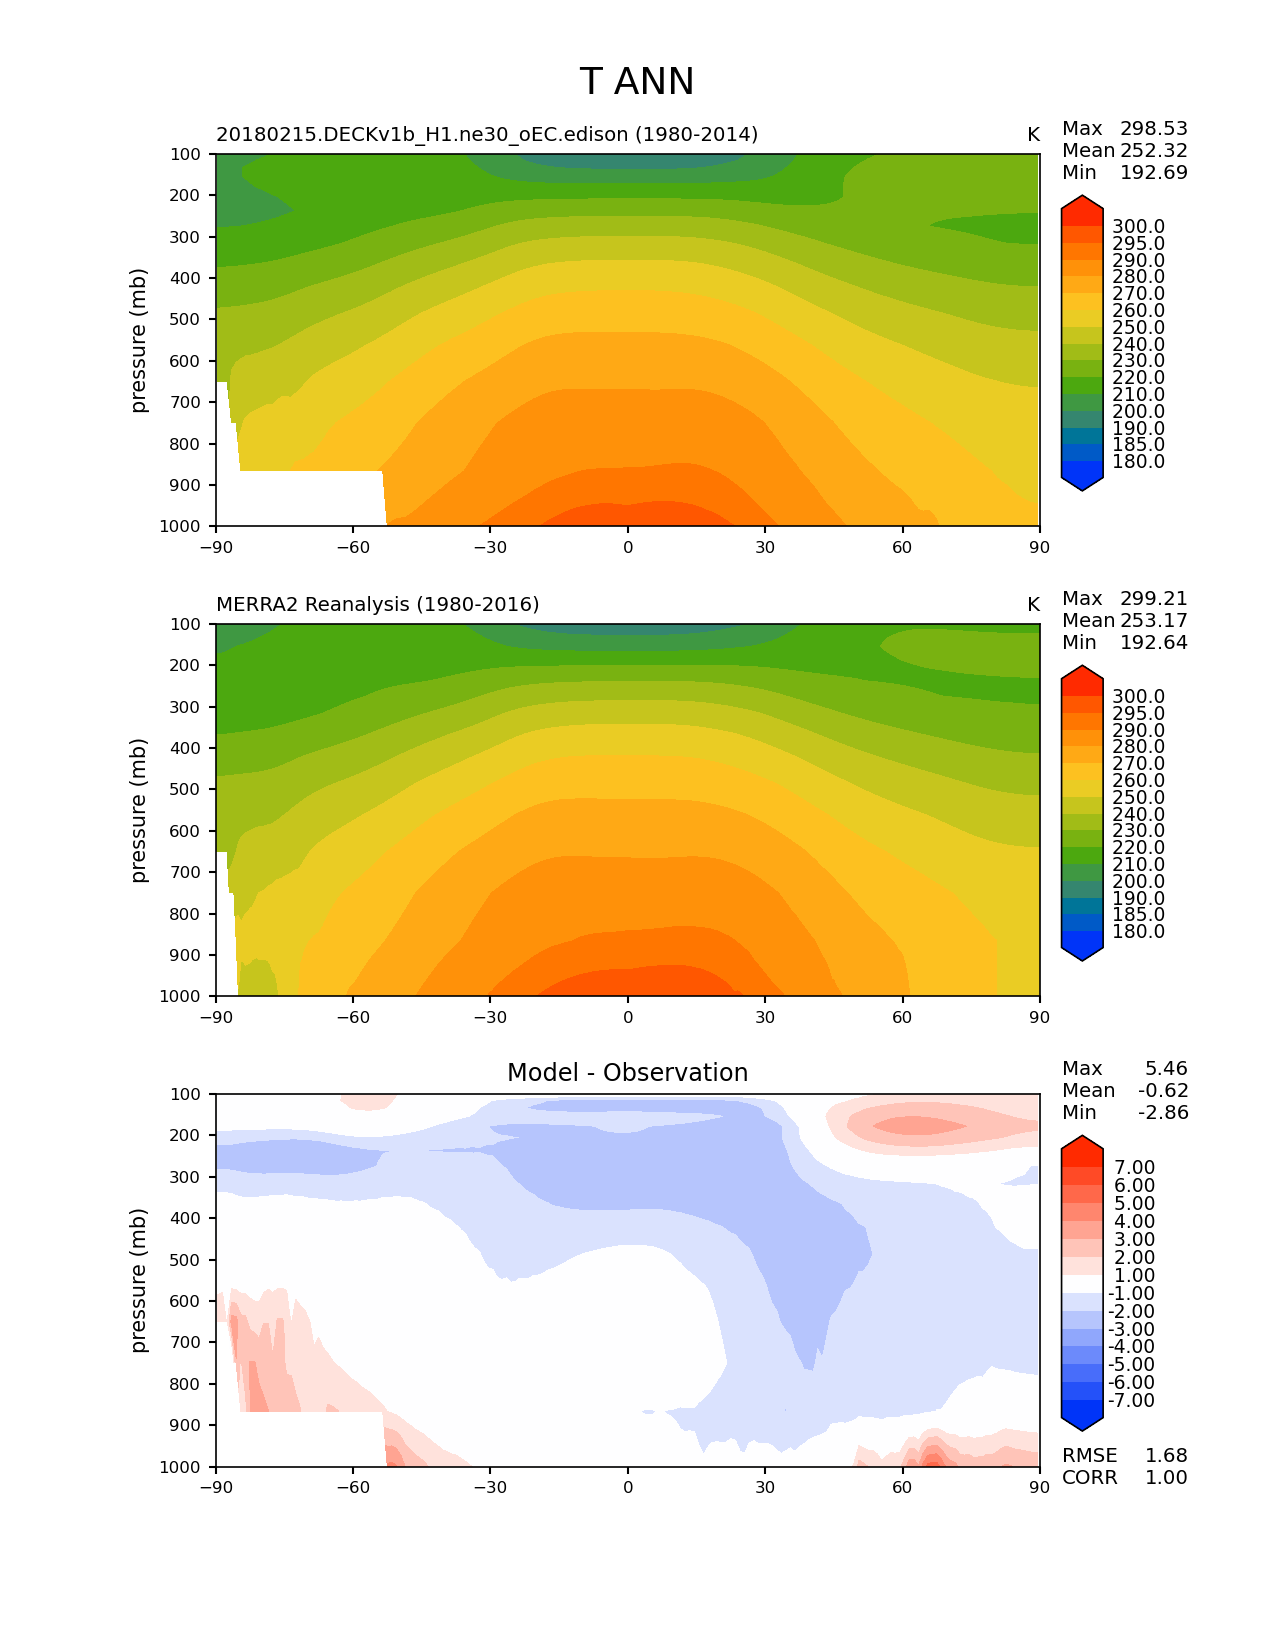
Pressure-latitude zonal mean contour |
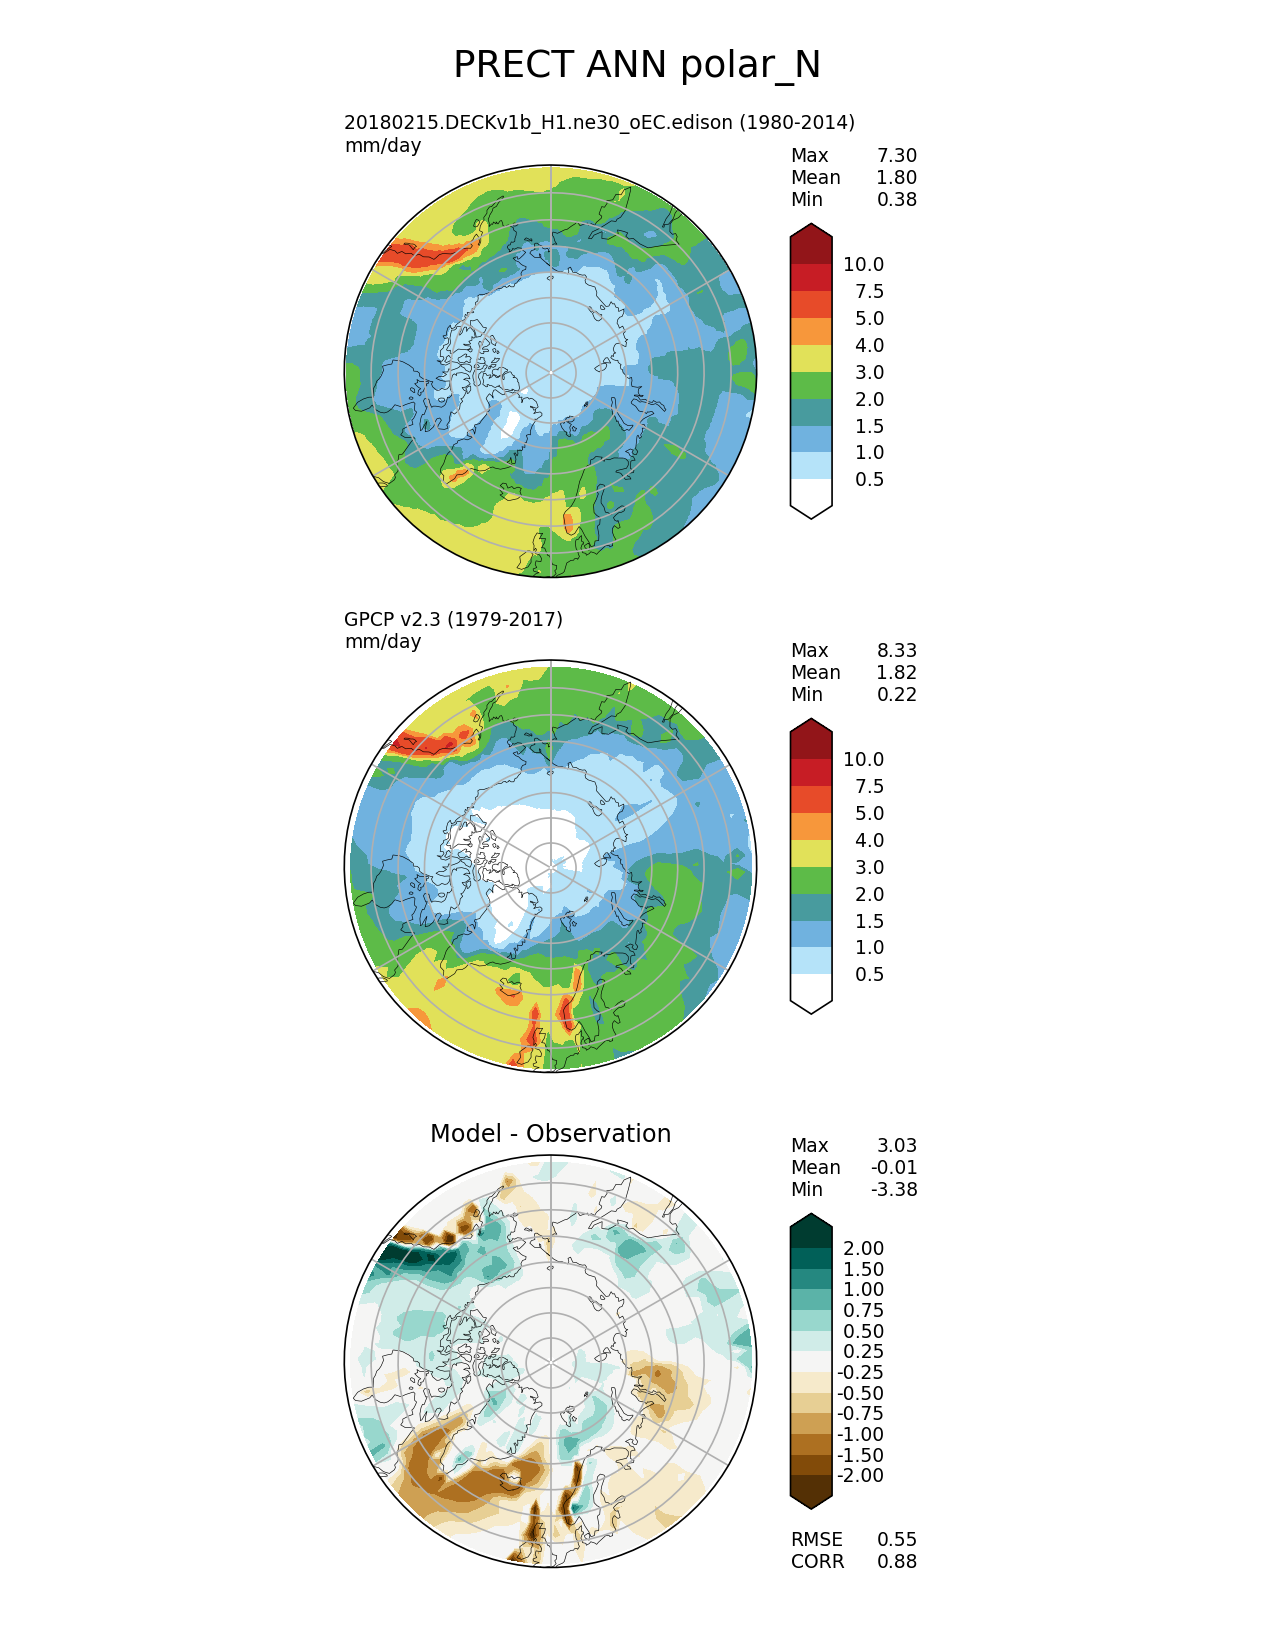
Polar contour map |
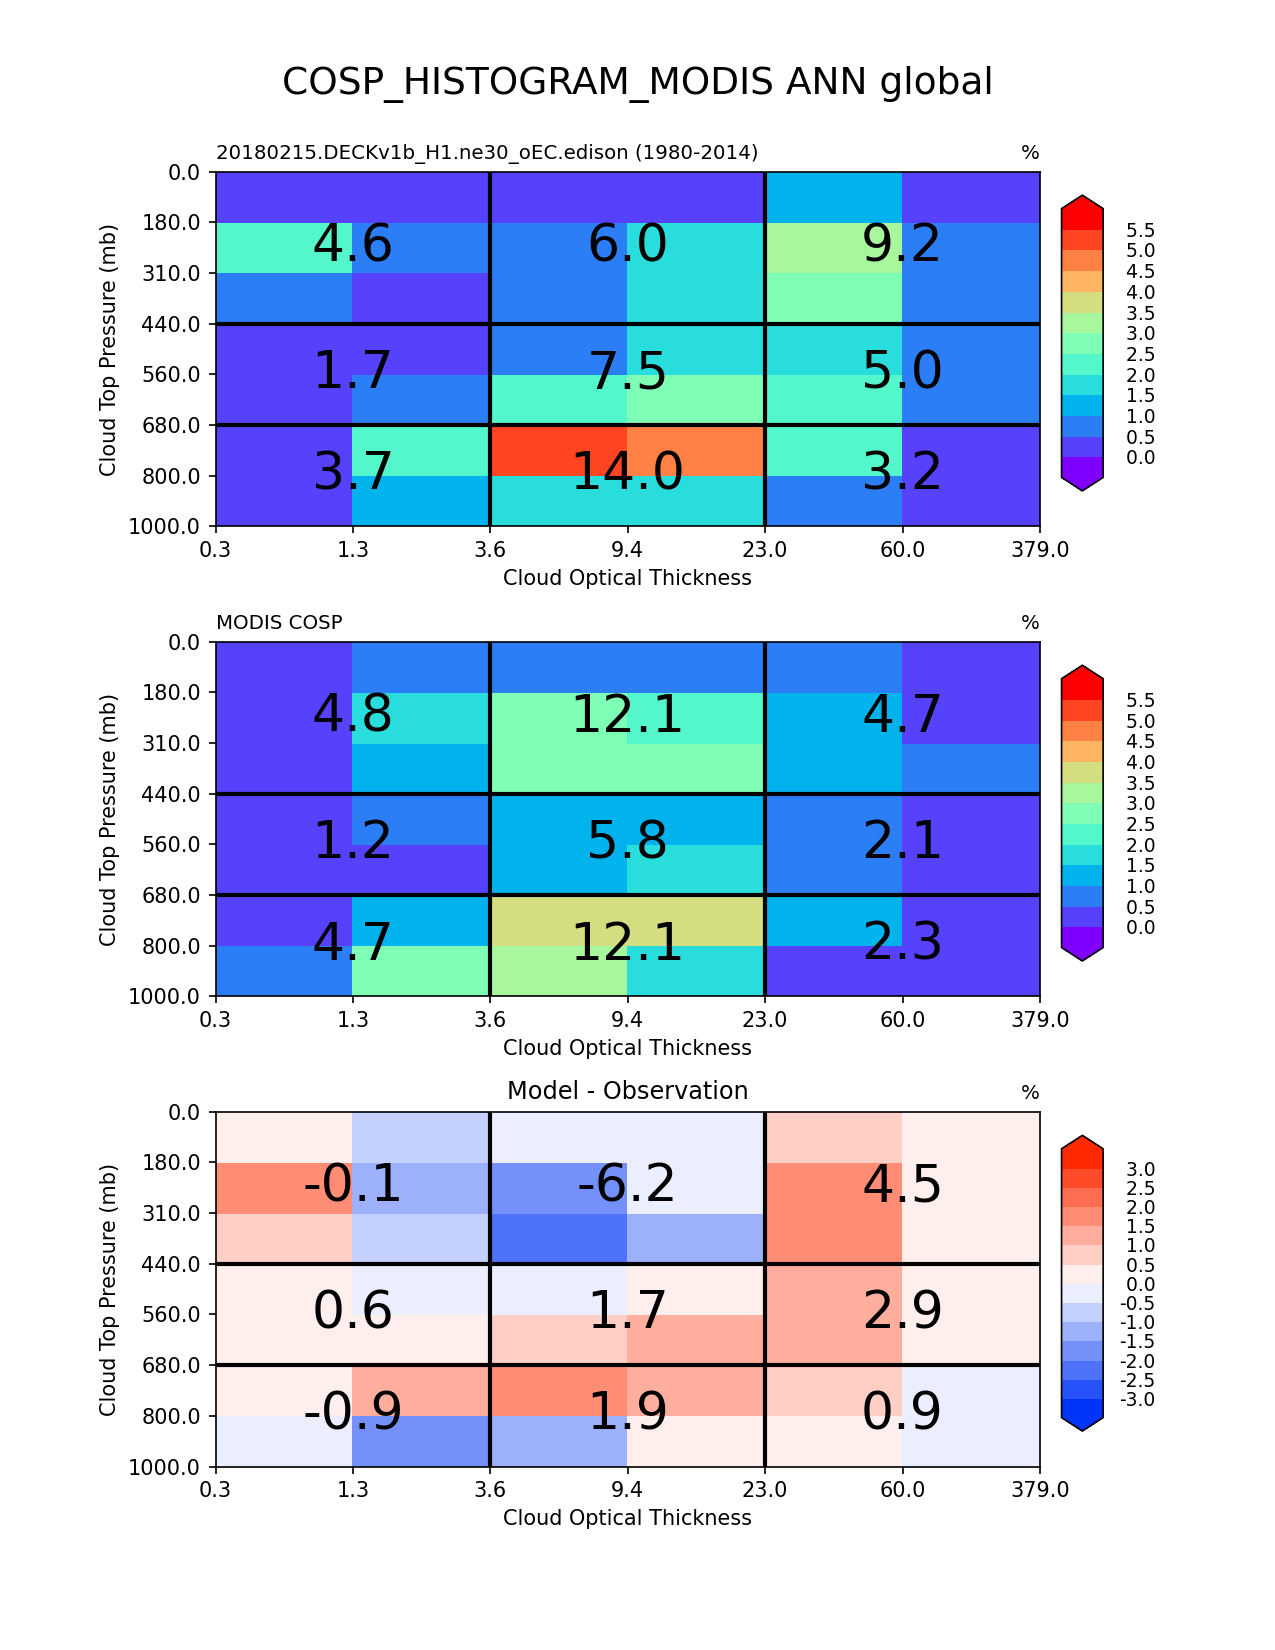
Cloud Top Height-Tau joint histograms |
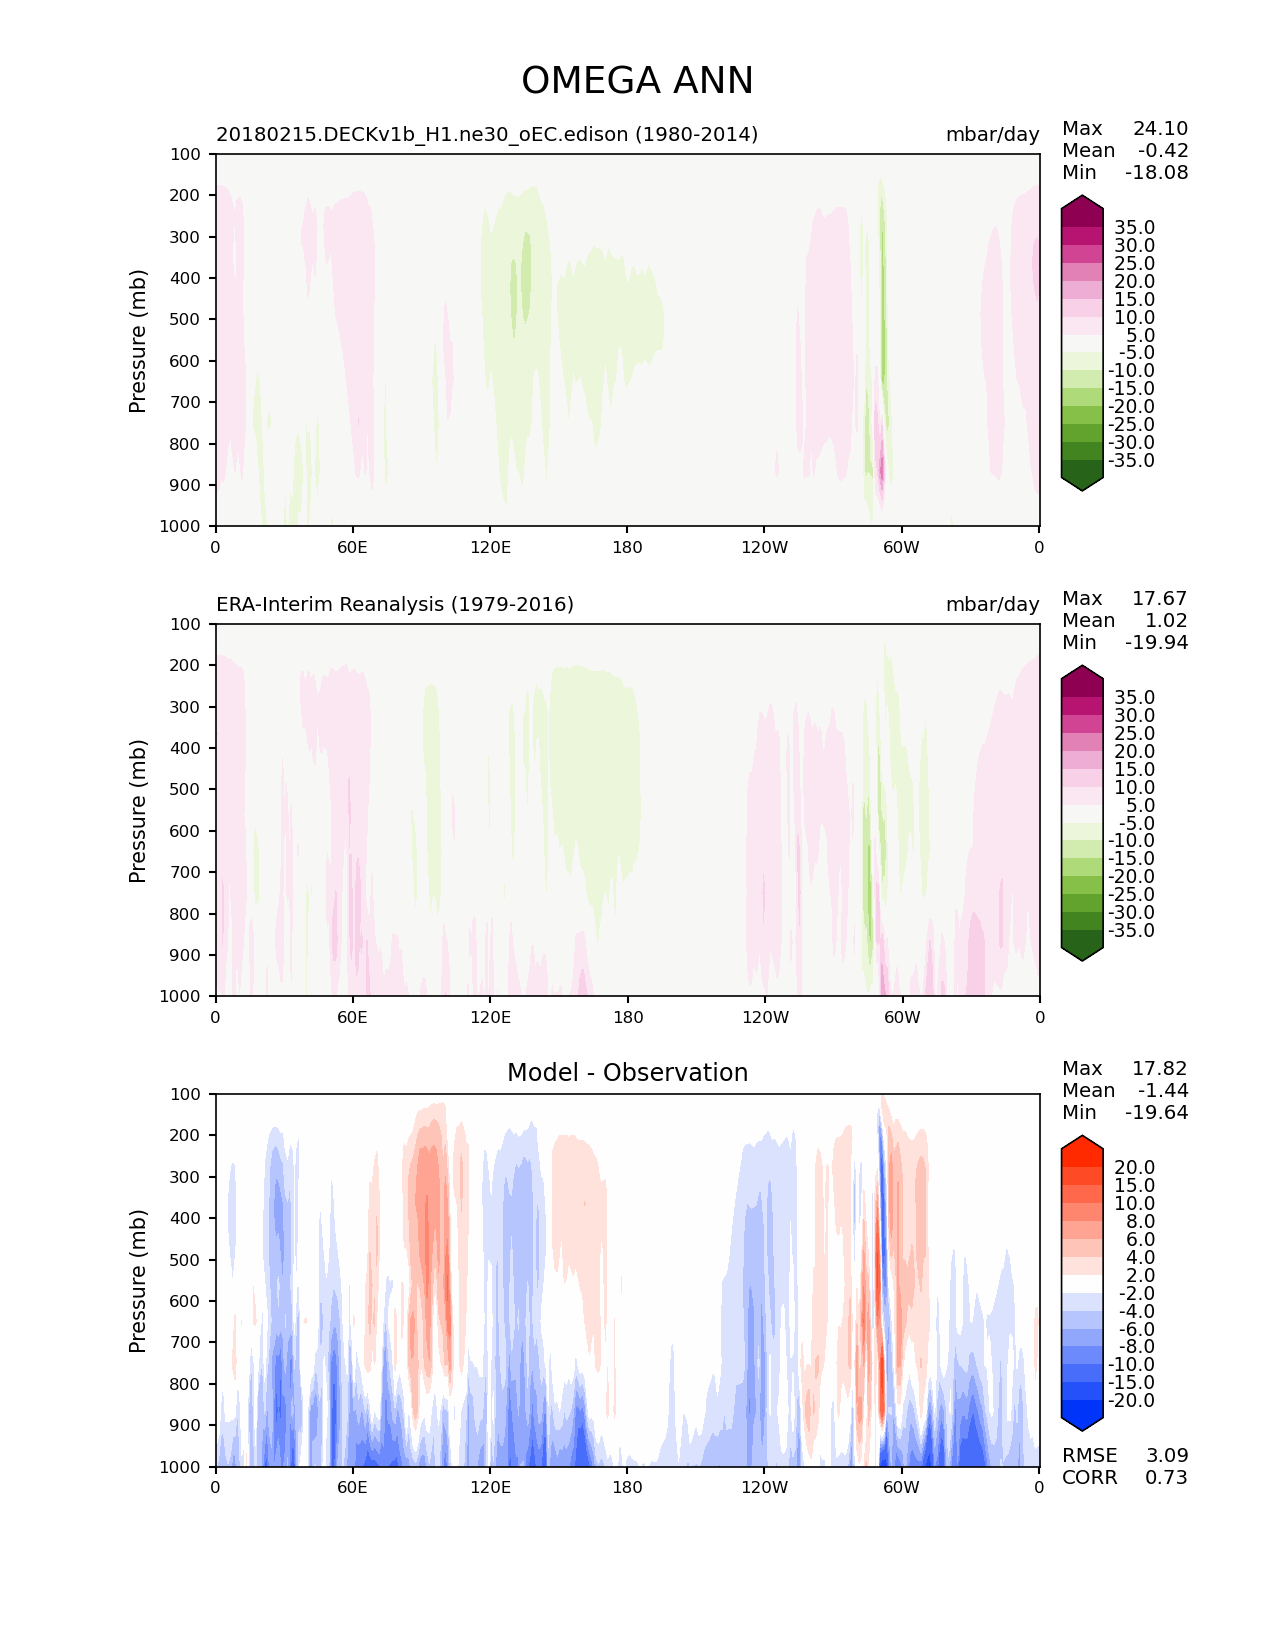
Pressure-longitude meridional mean contour |
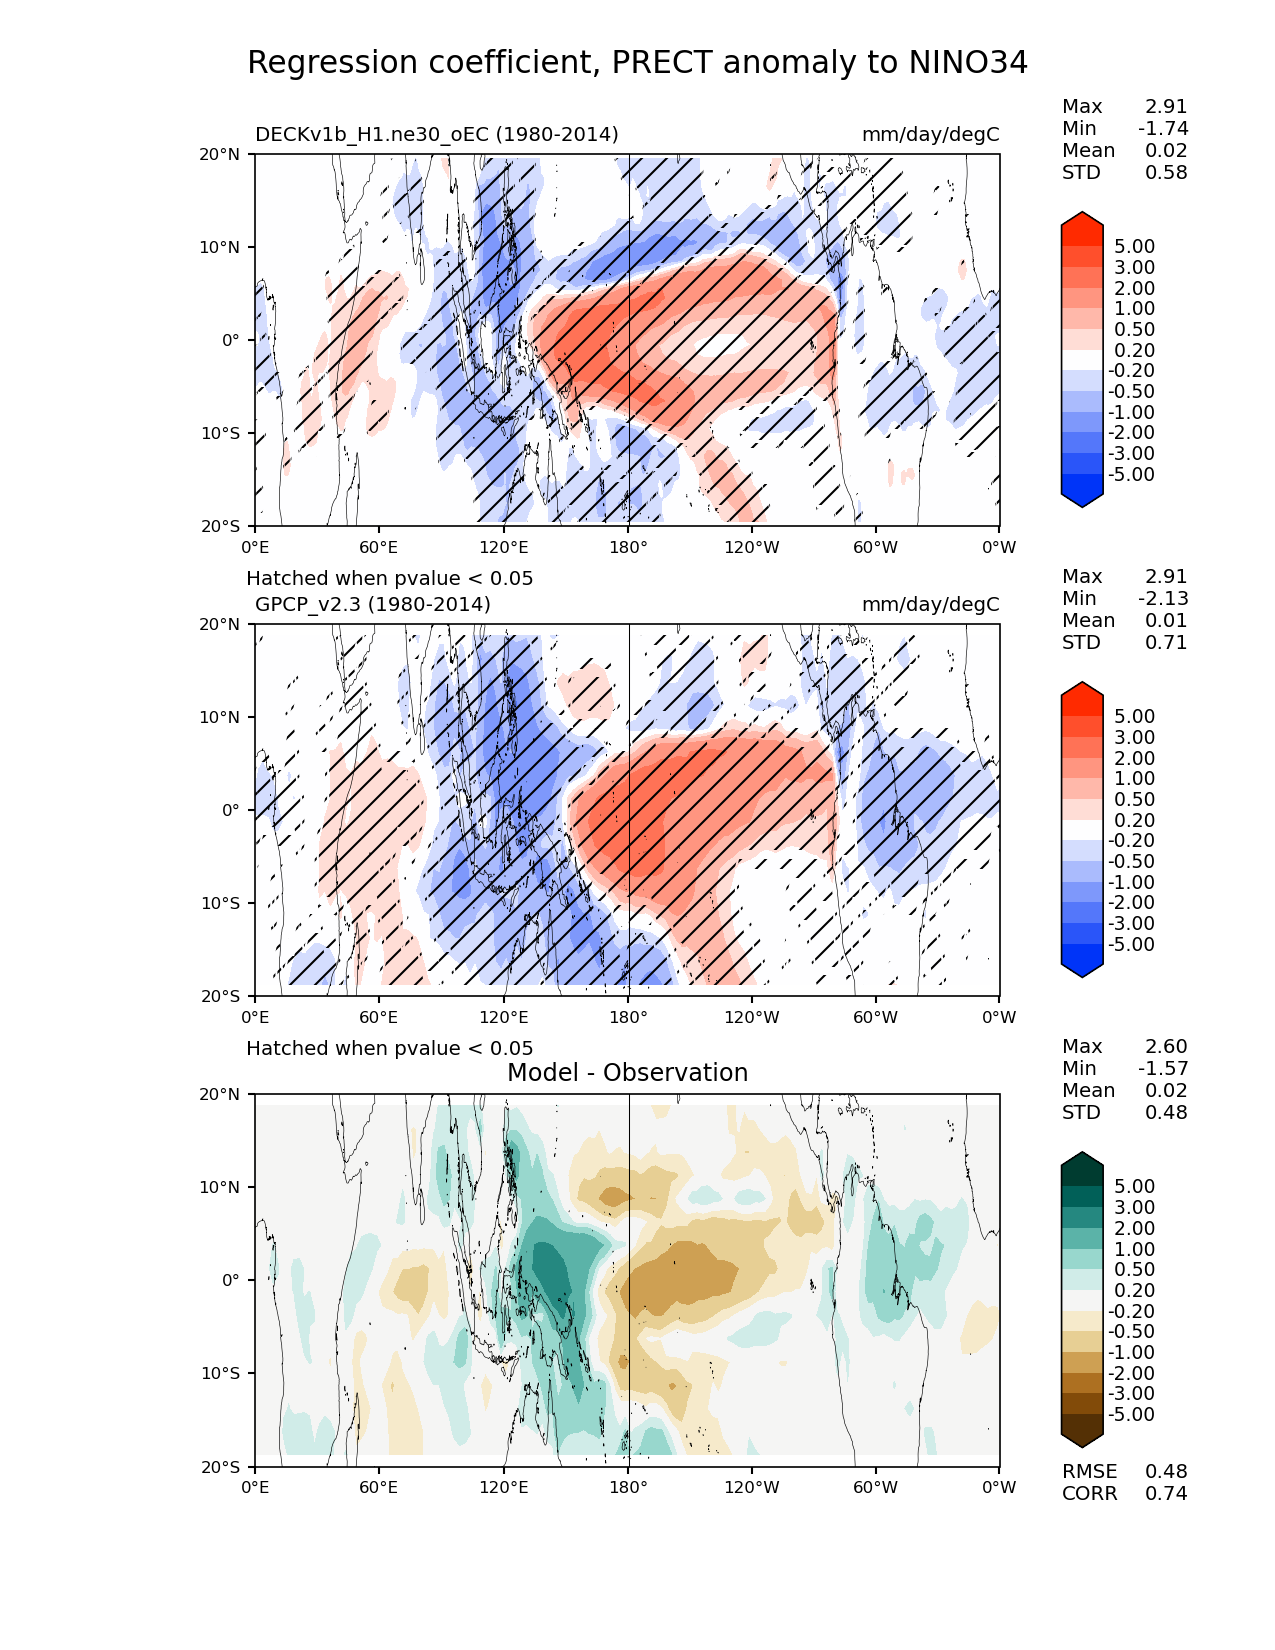
ENSO diagnostics map |

ENSO diagnostics scatter plot |
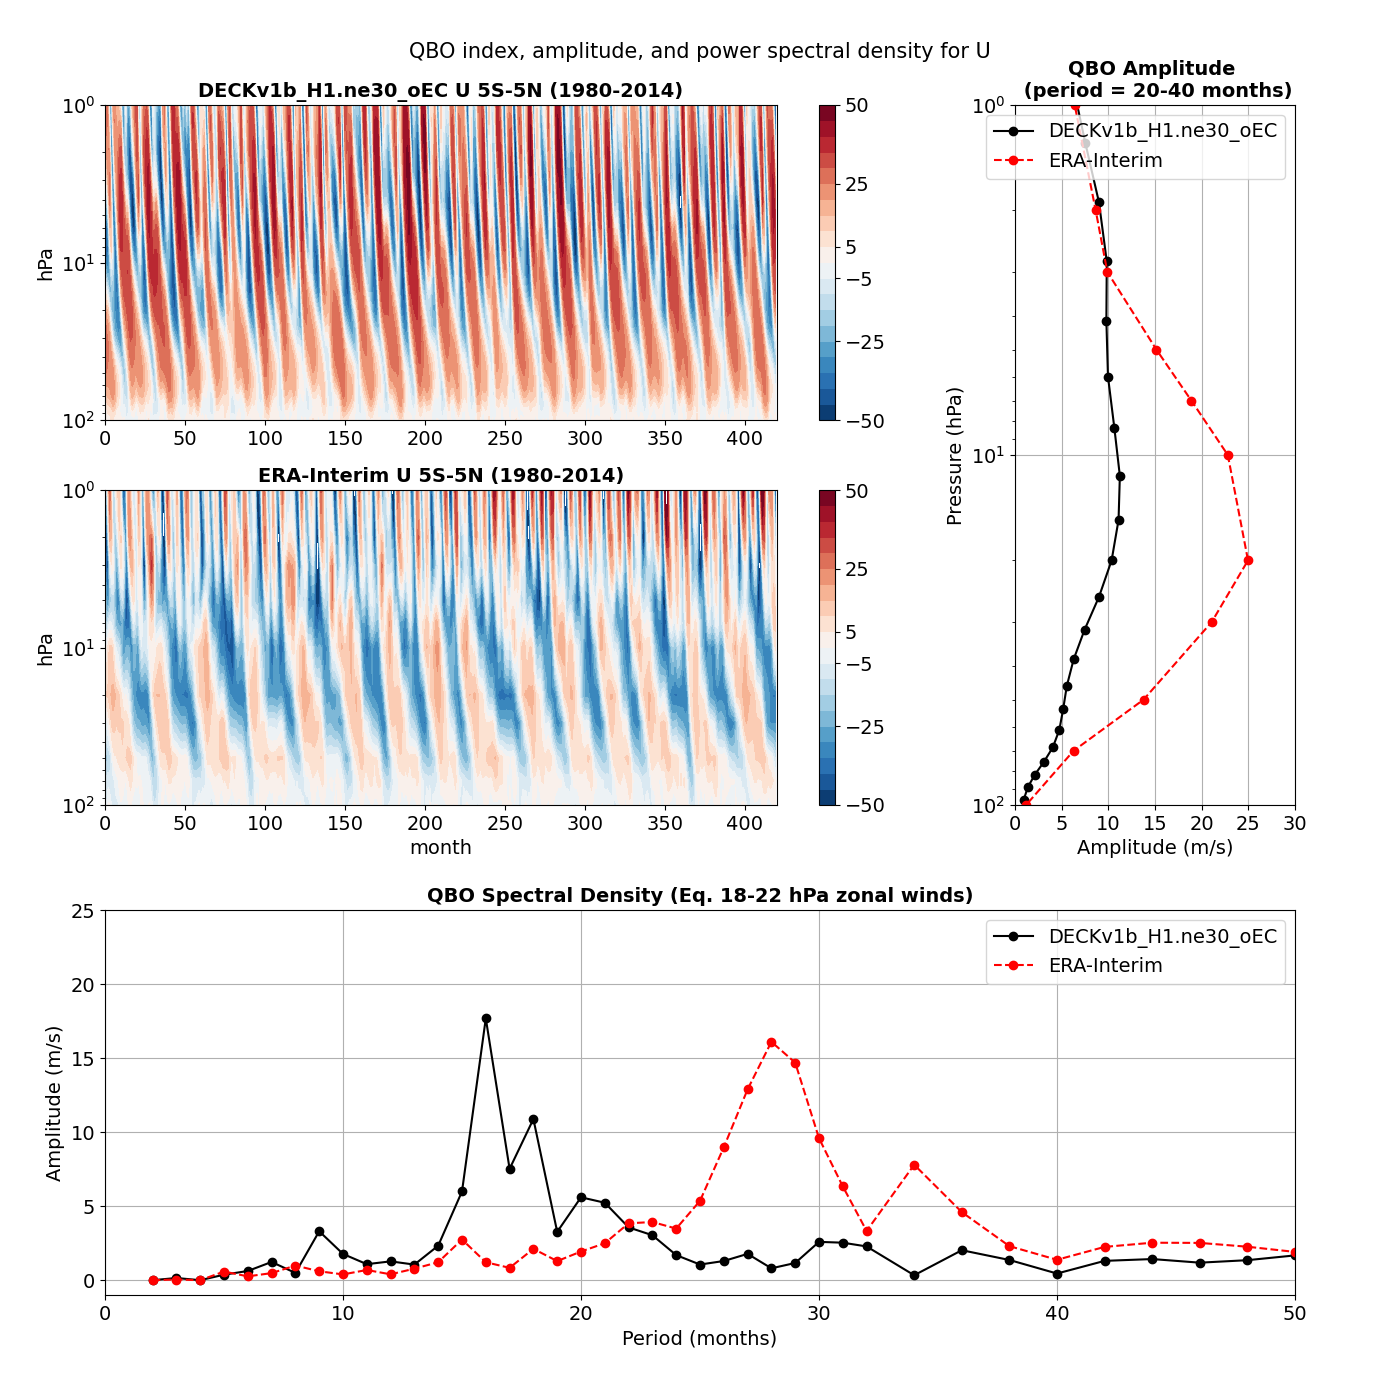
QBO |
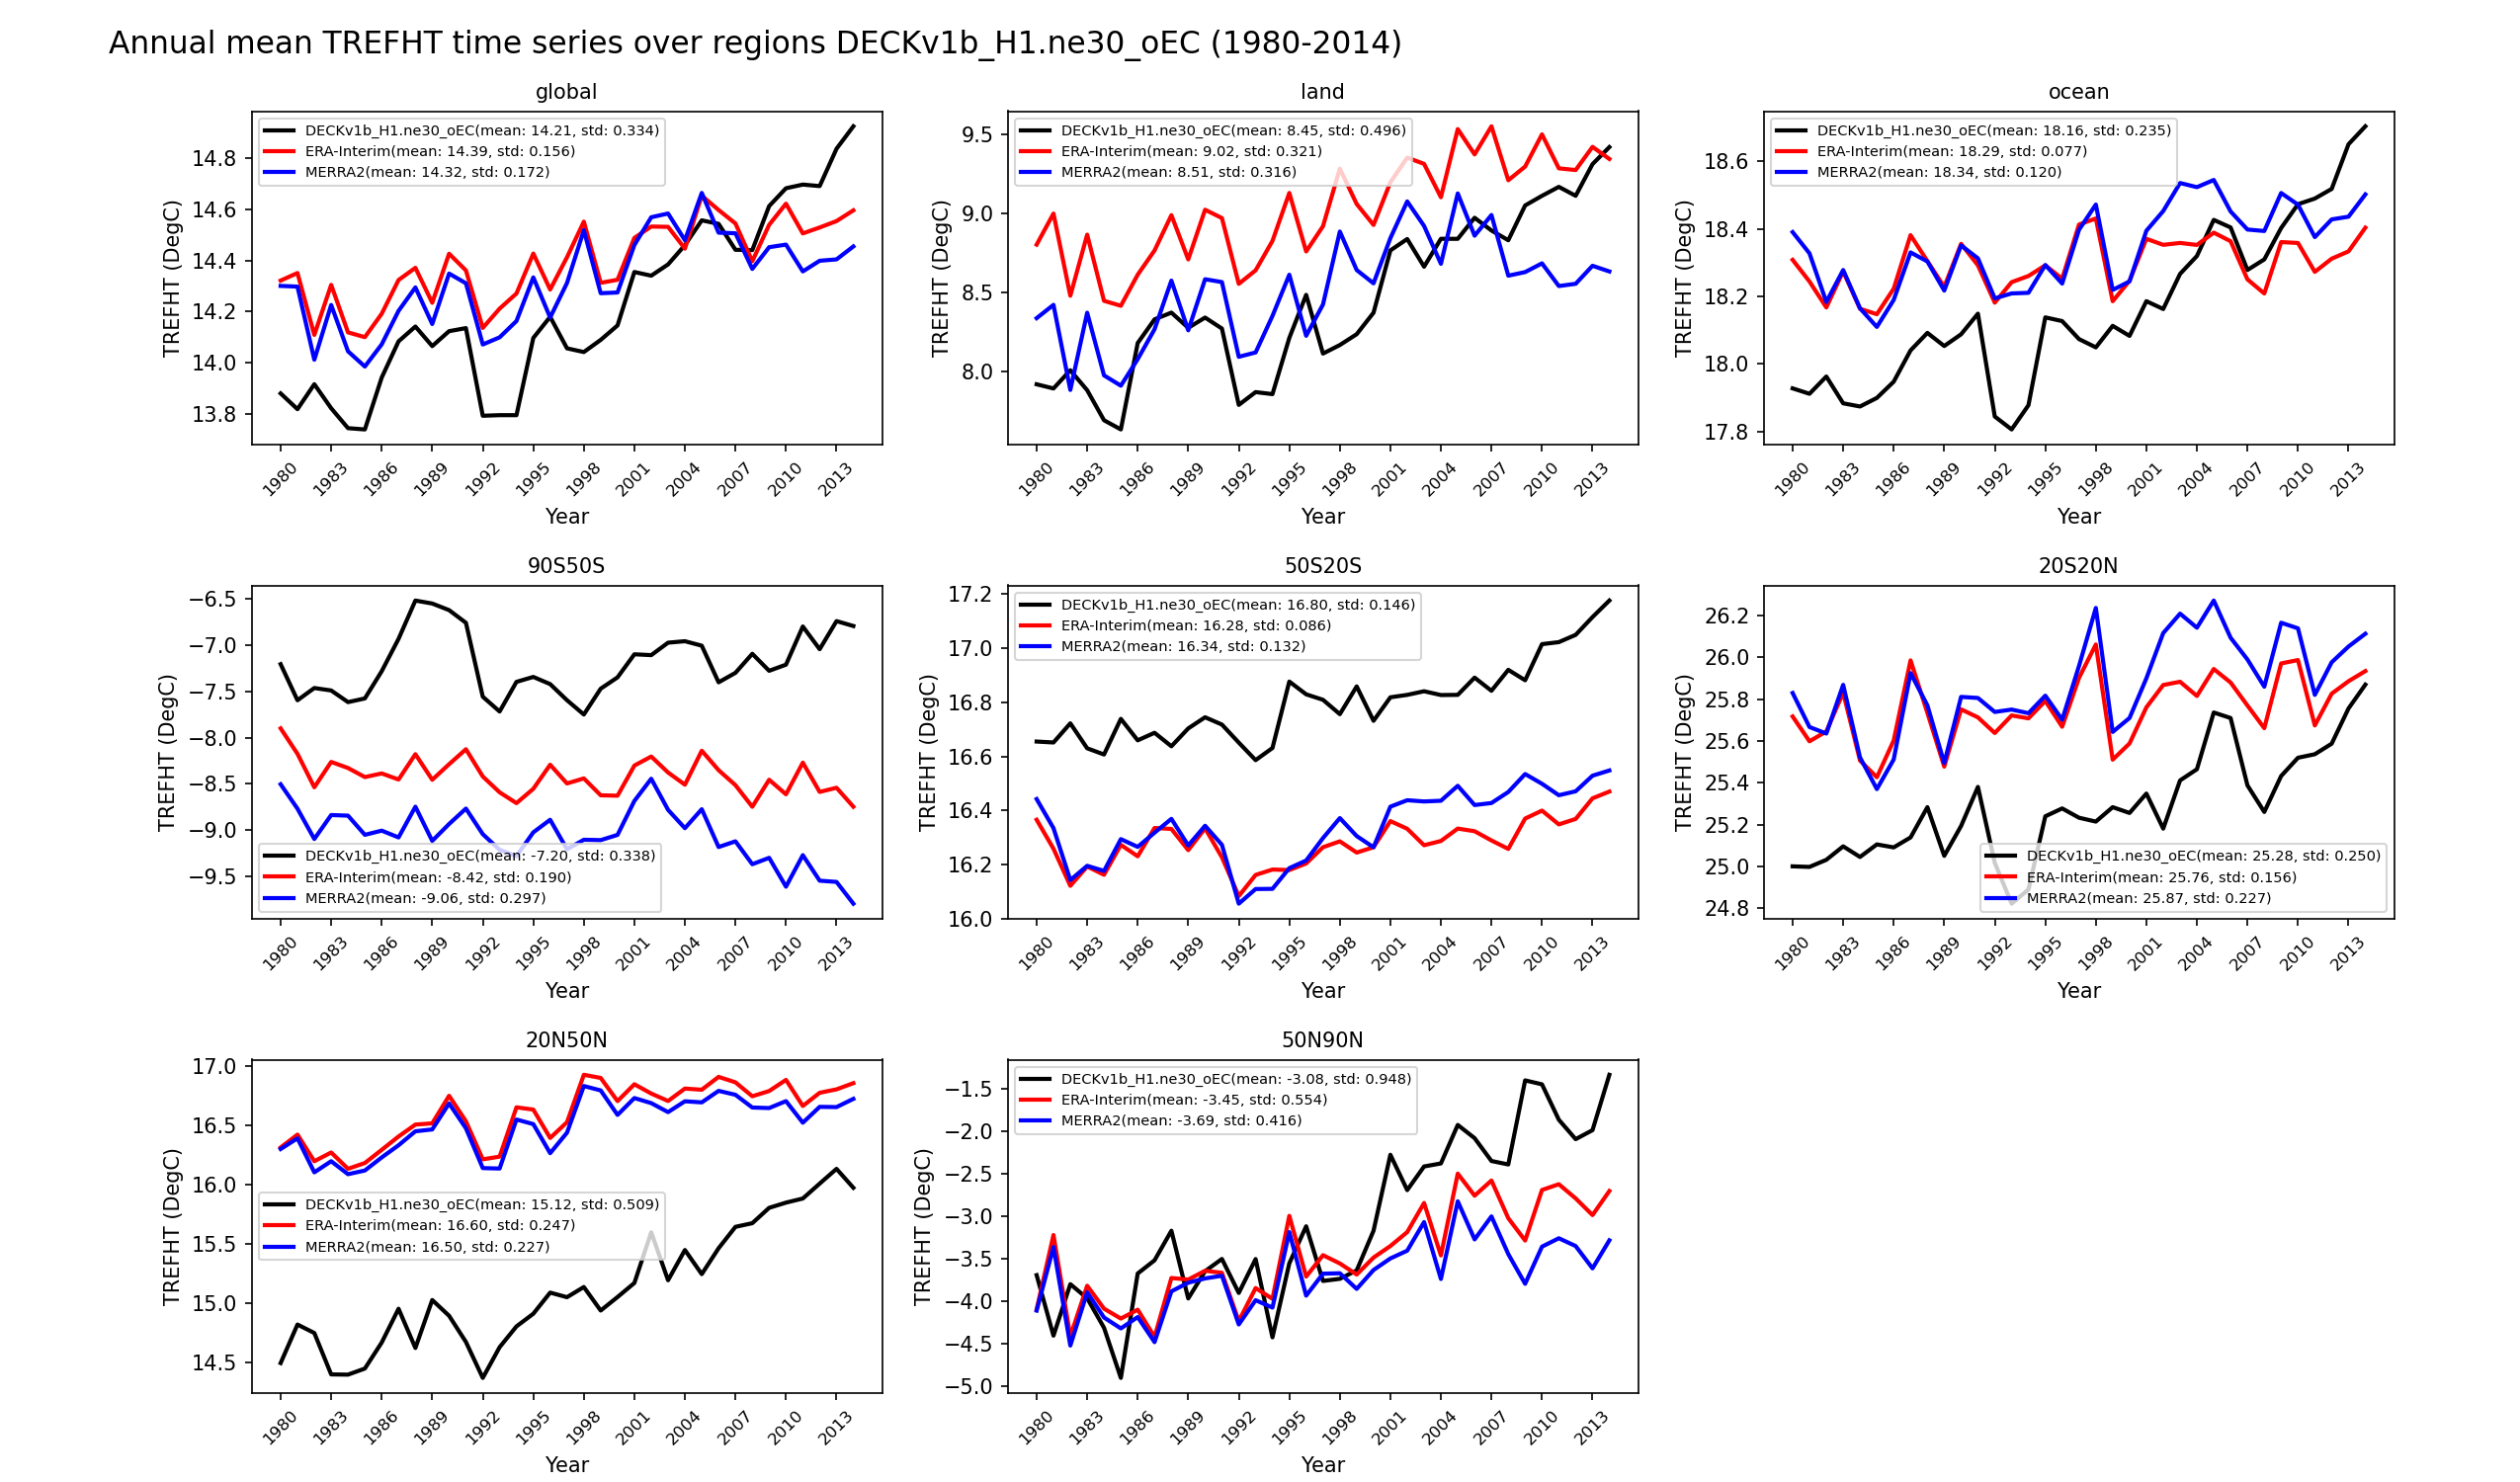
Area Mean time series |
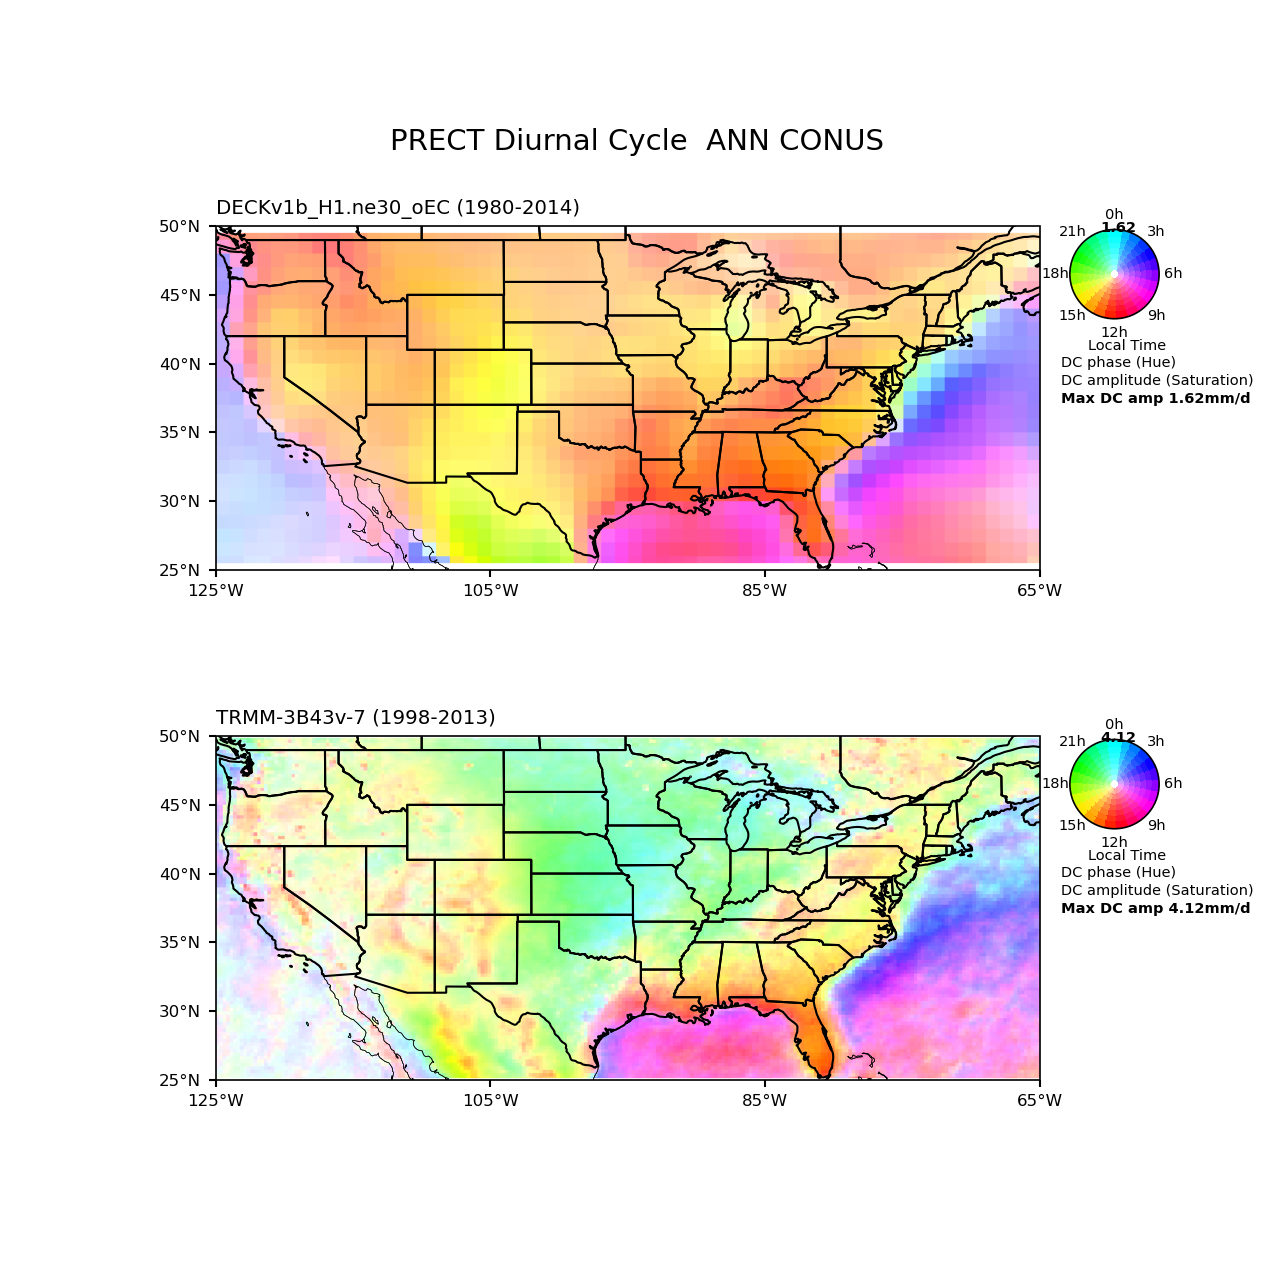
Diurnal cycle phase maps |
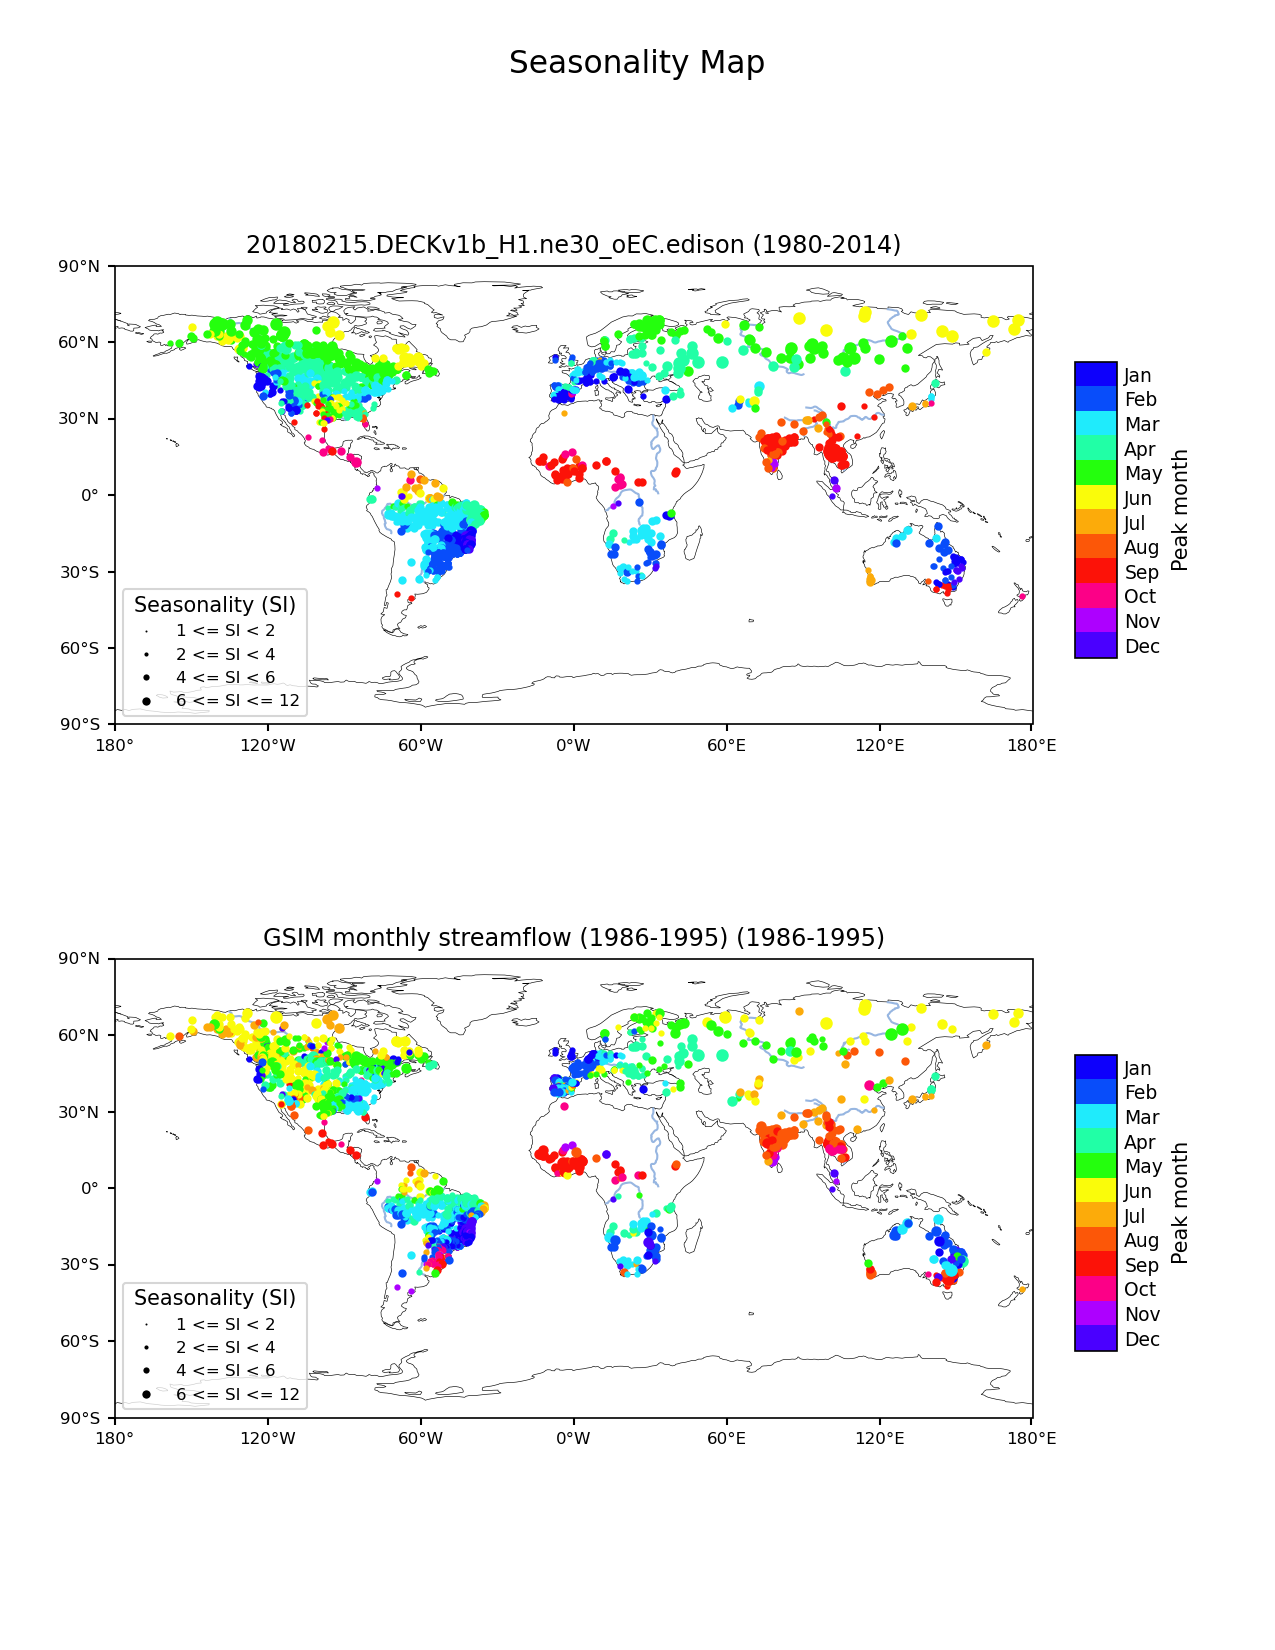
Streamflow seasonality map |
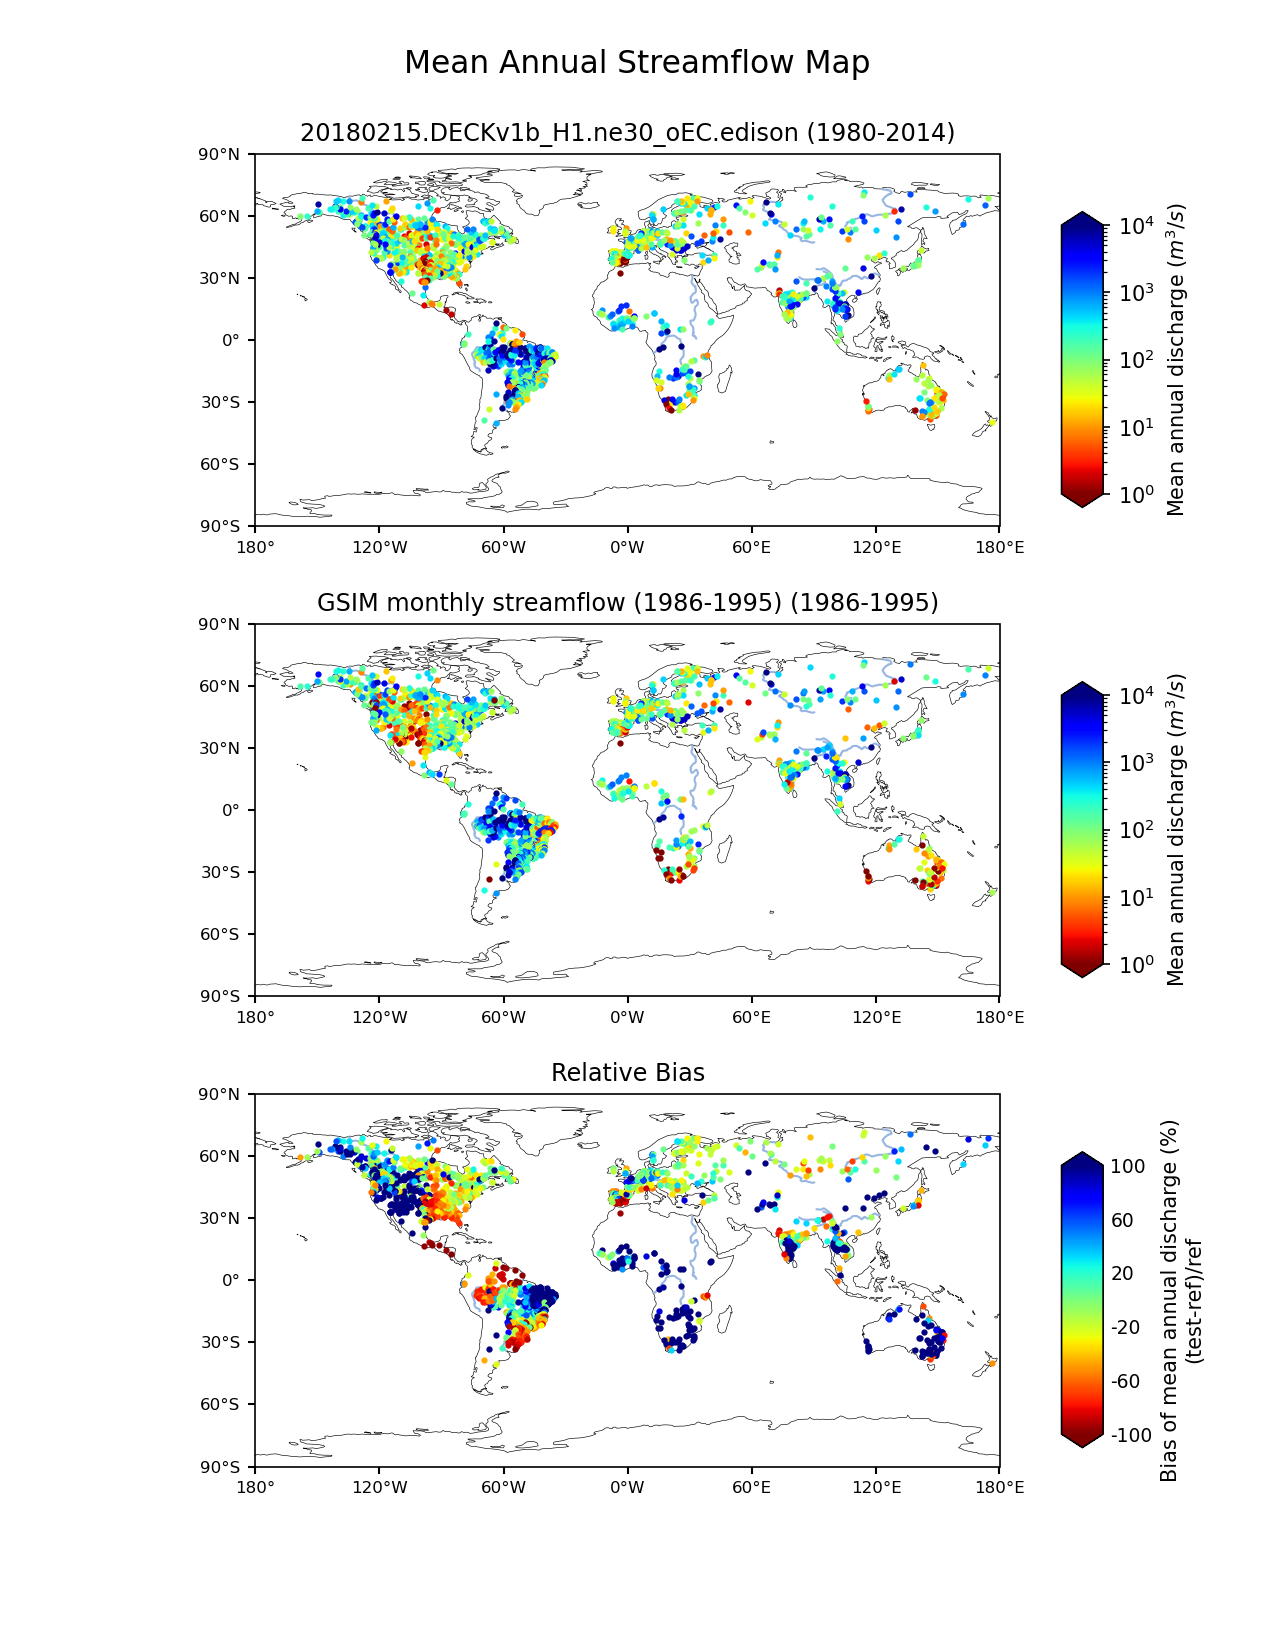
Mean annual streamflow map |
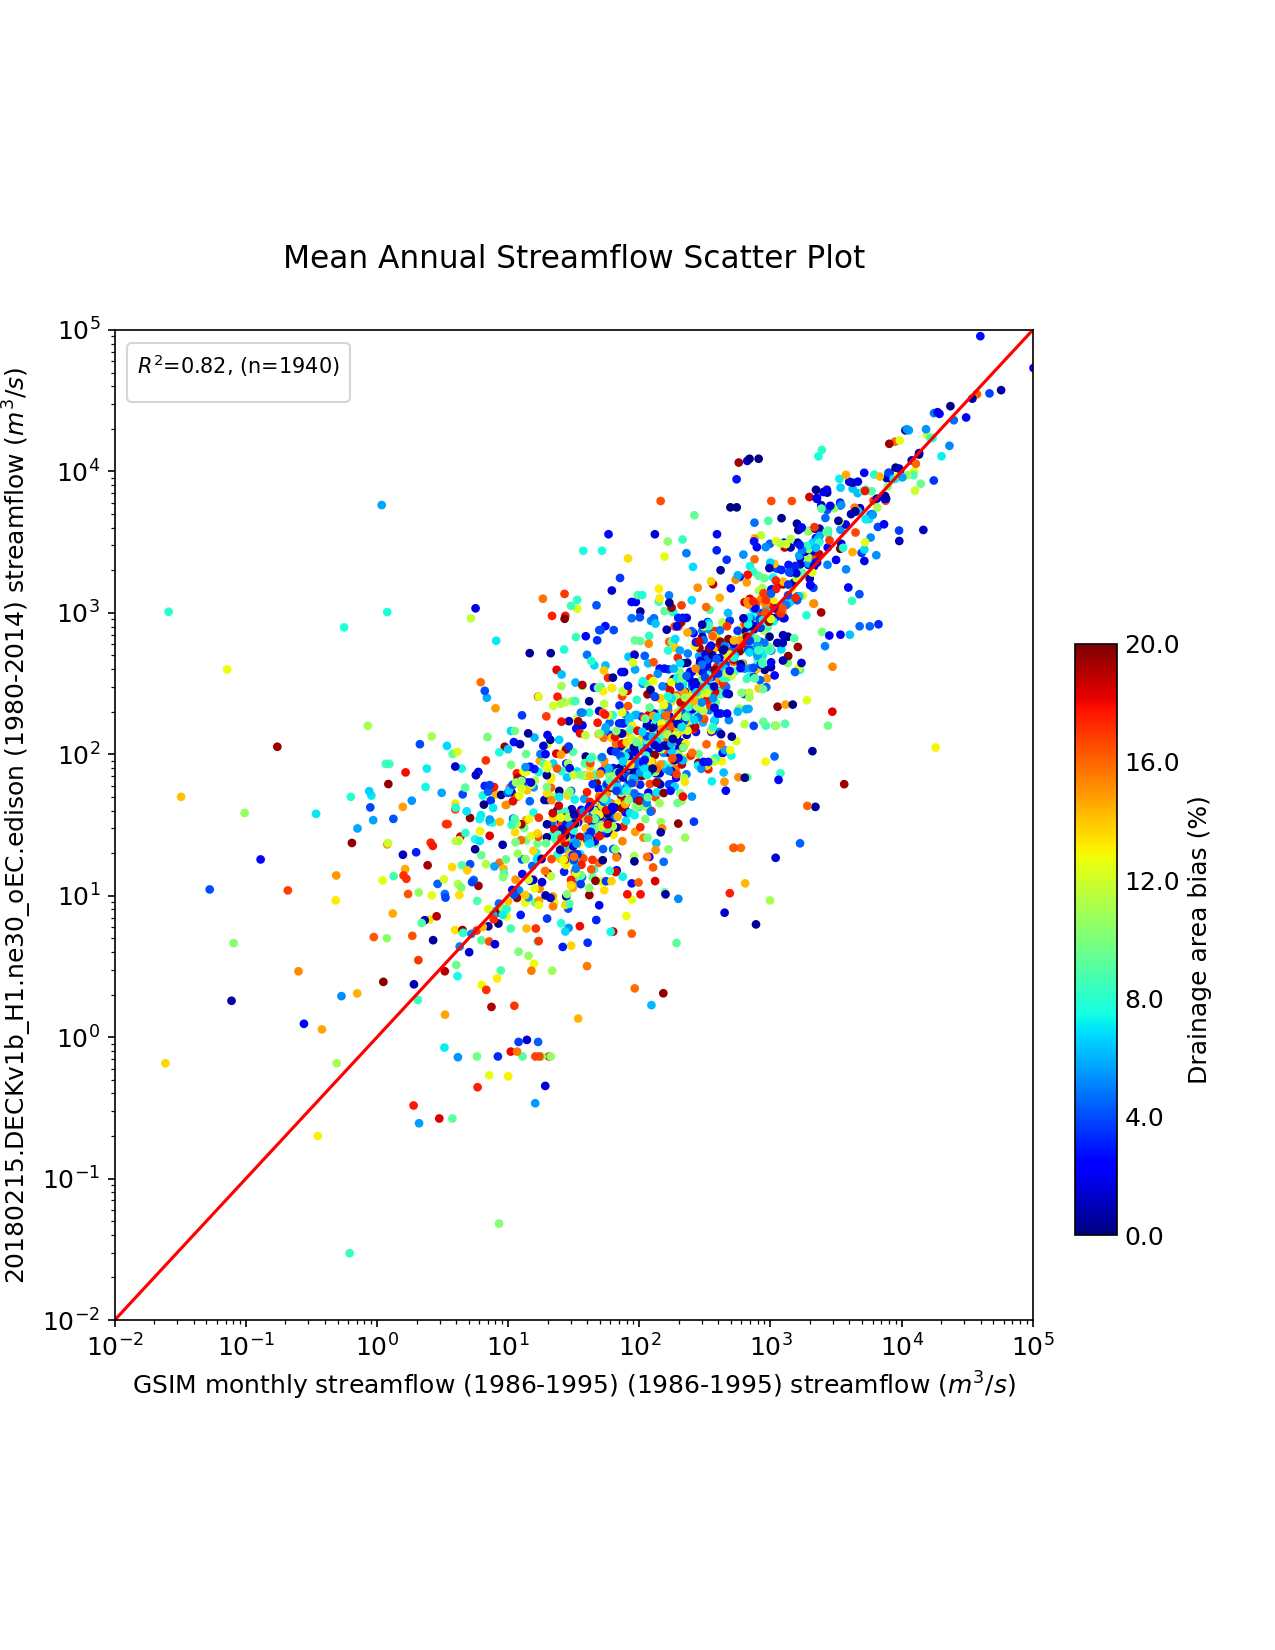
Mean annual streamflow scatter plot |
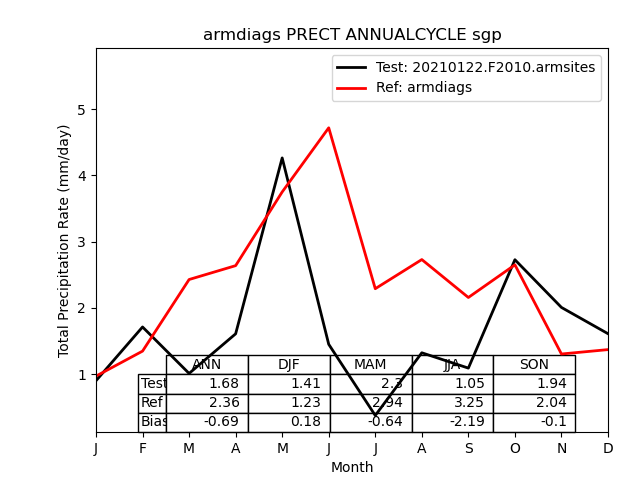
ARM diagnostics annual cycle plot |
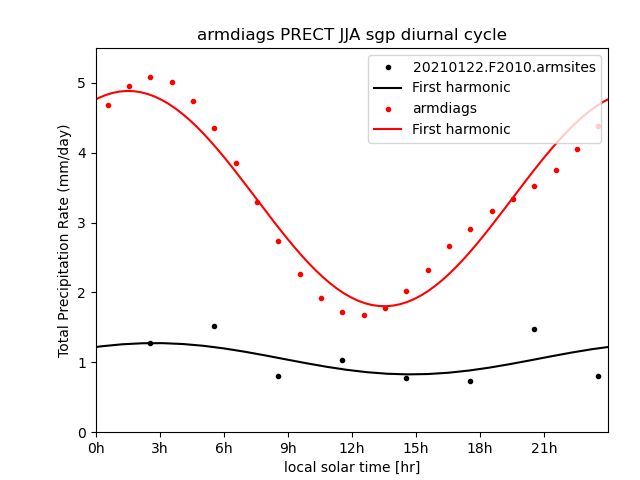
ARM diagnostics diurnal cycle plot |
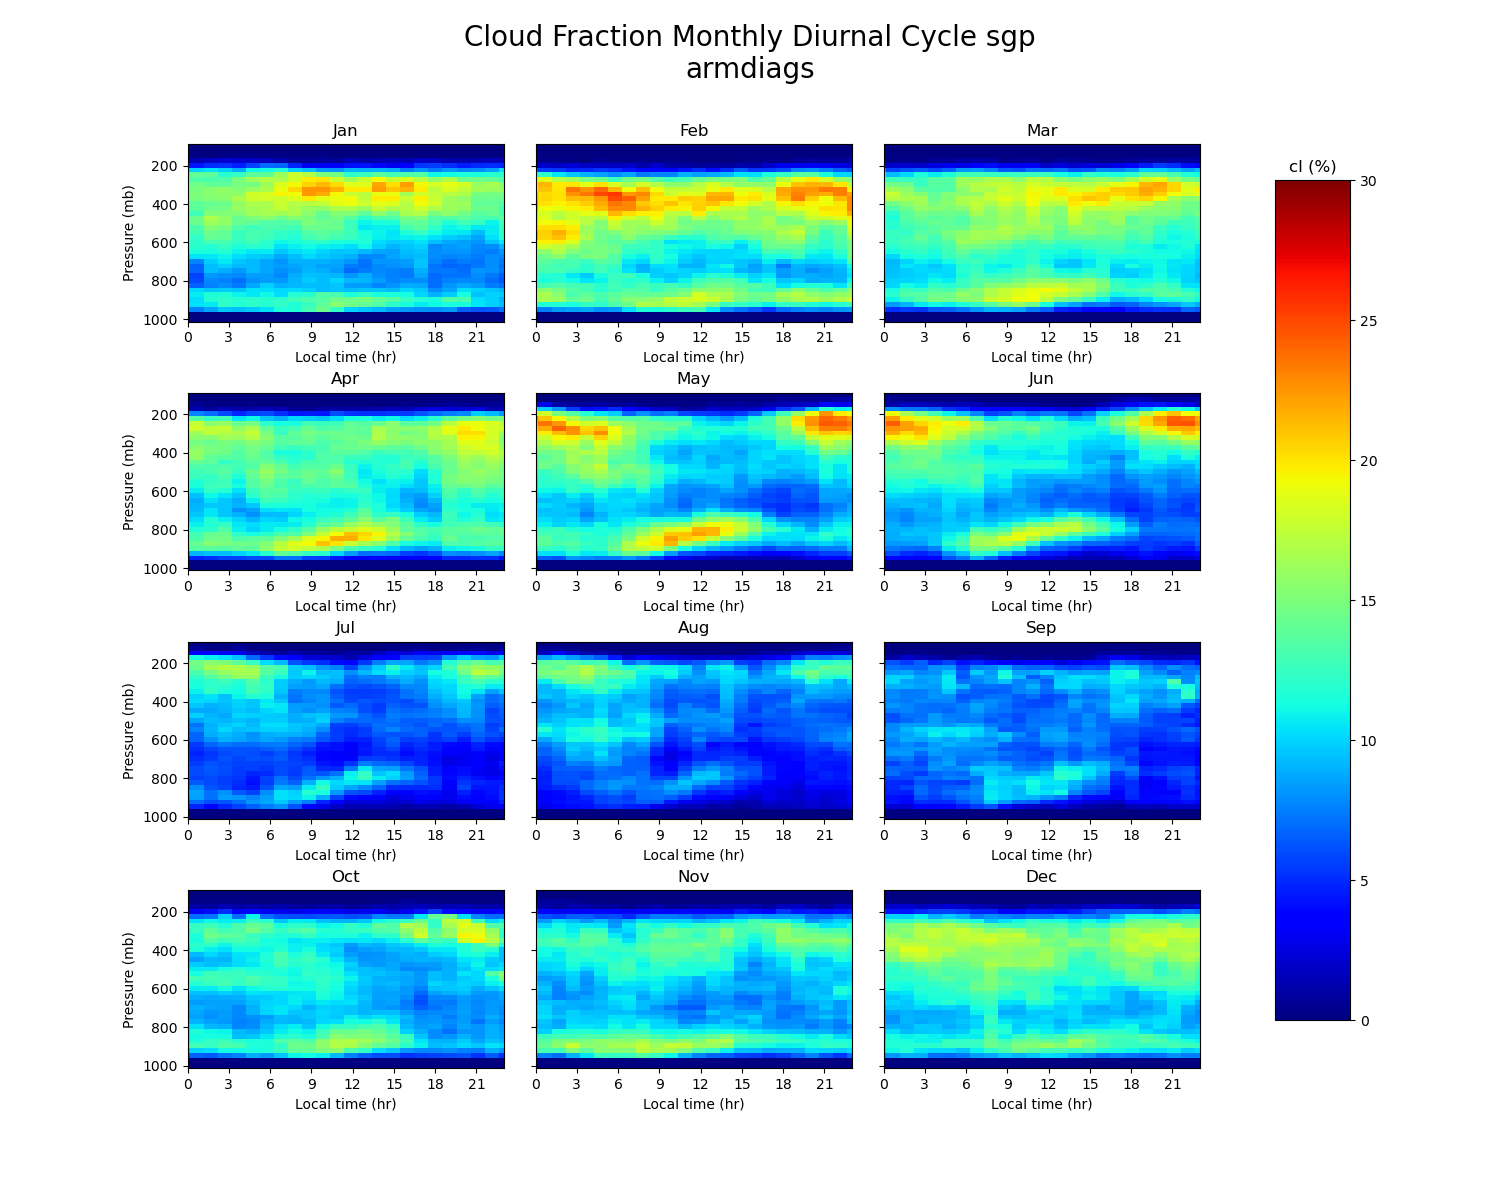
ARM diagnostics monthly diurnal cycle of cloud plot |
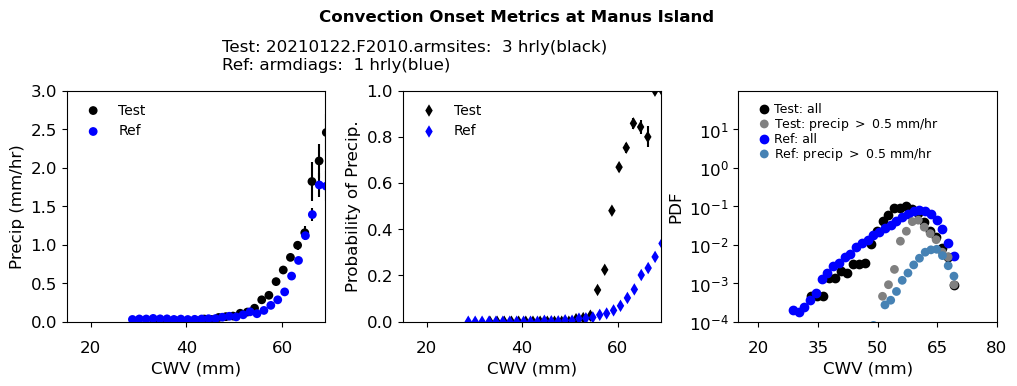
ARM diagnostics convection onset statistics plot |
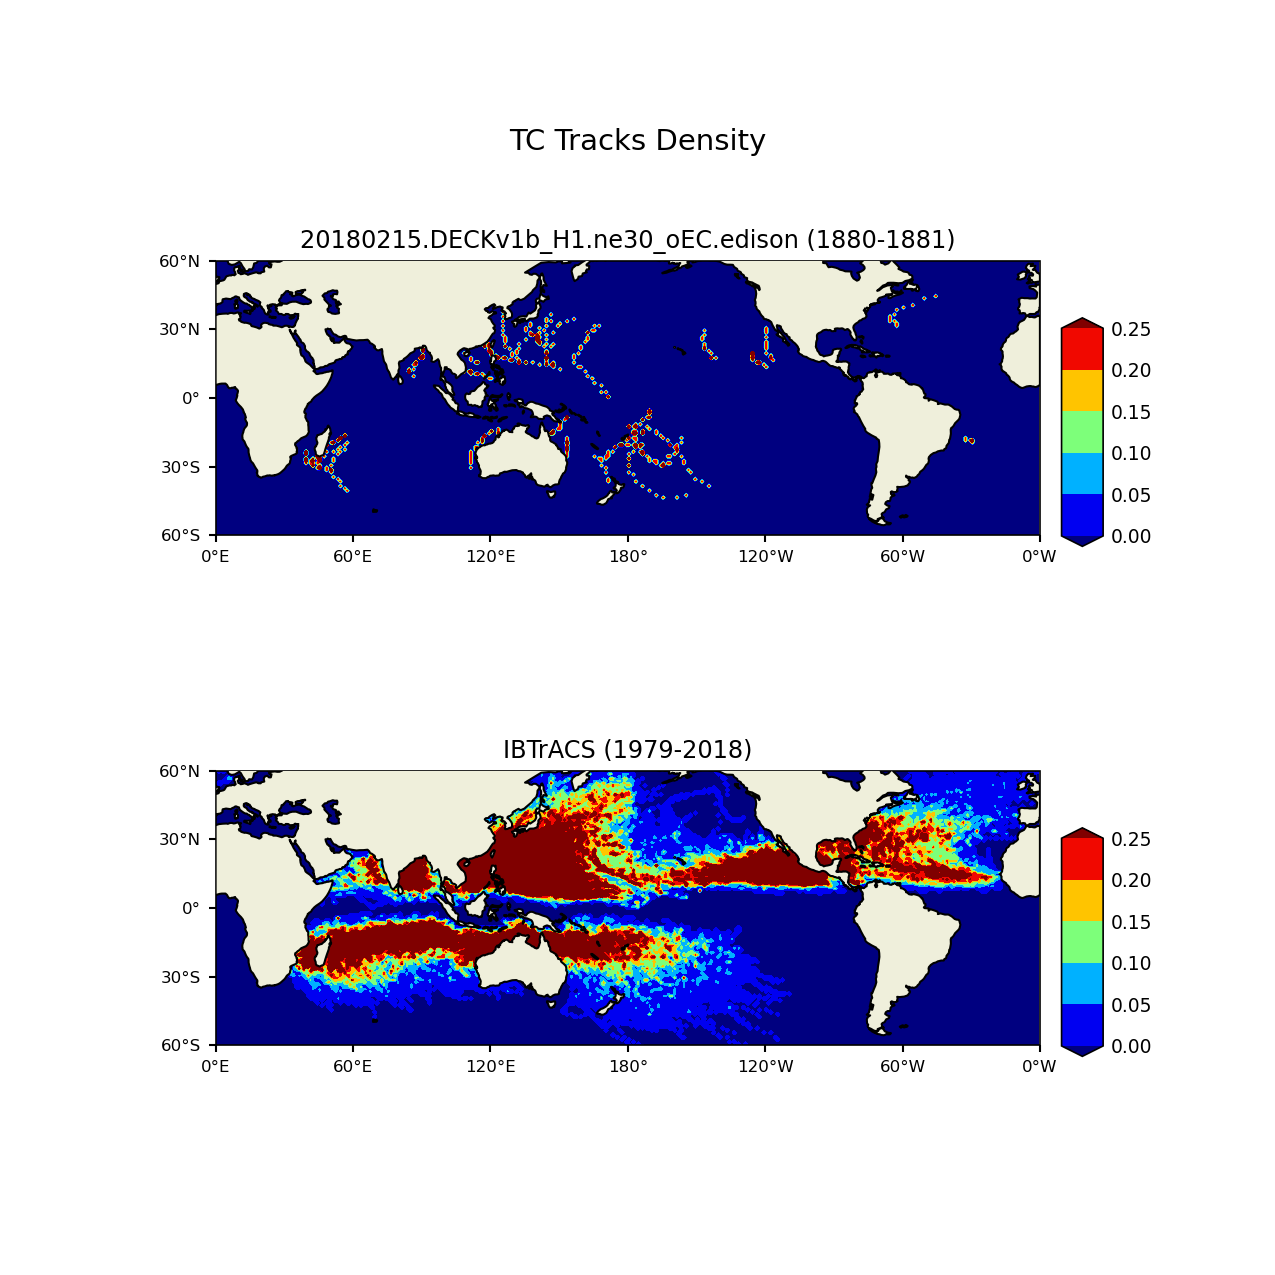
Tropical Cyclone Track Density |
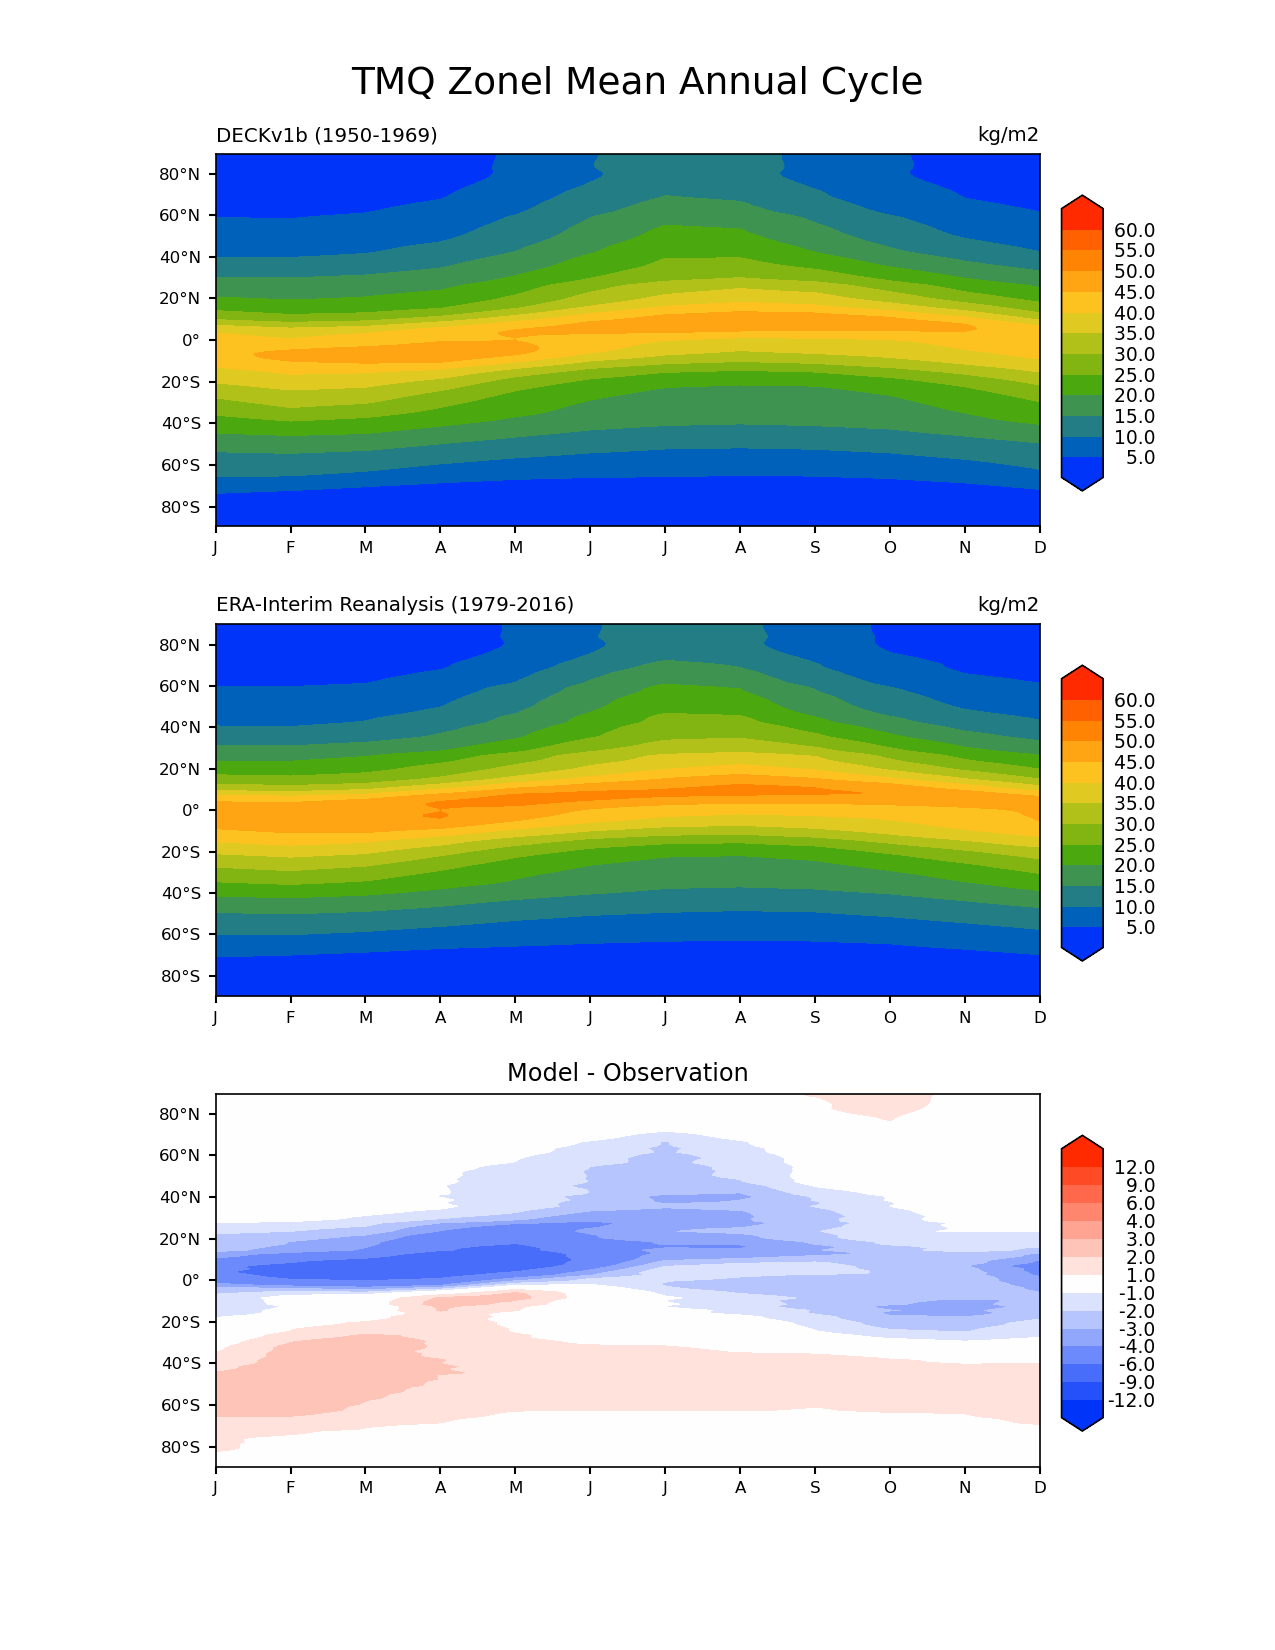
Annual Cycle Zonel Mean plot |
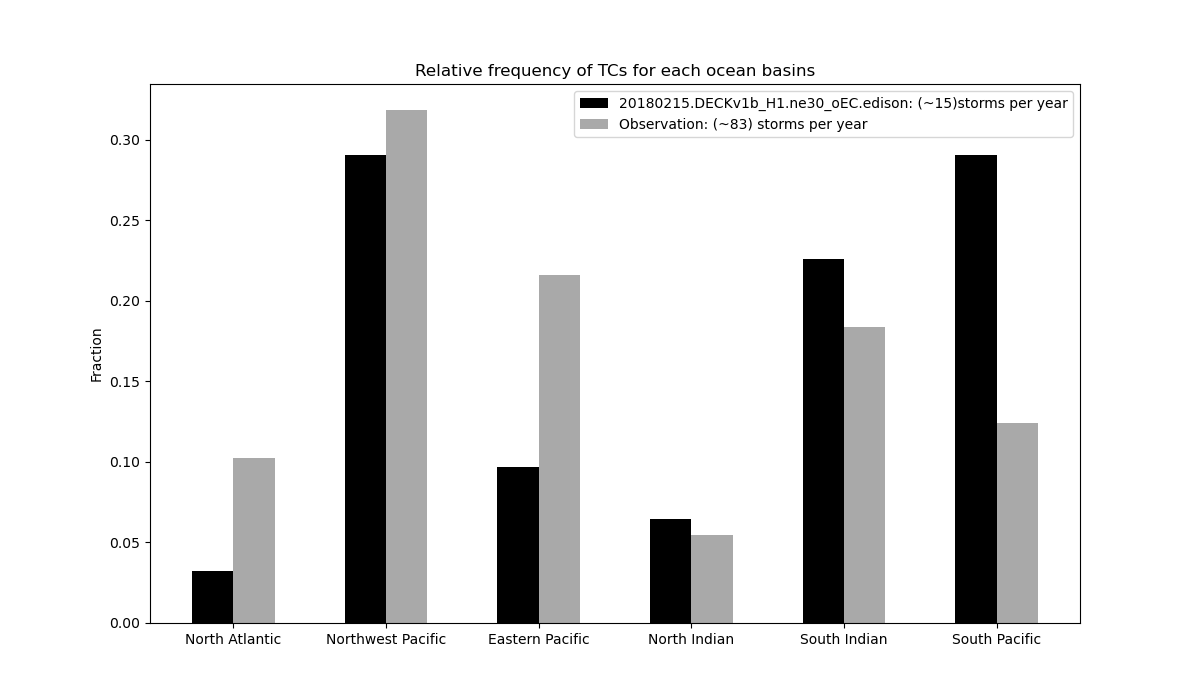
Tropical Cyclone frequency per basin |
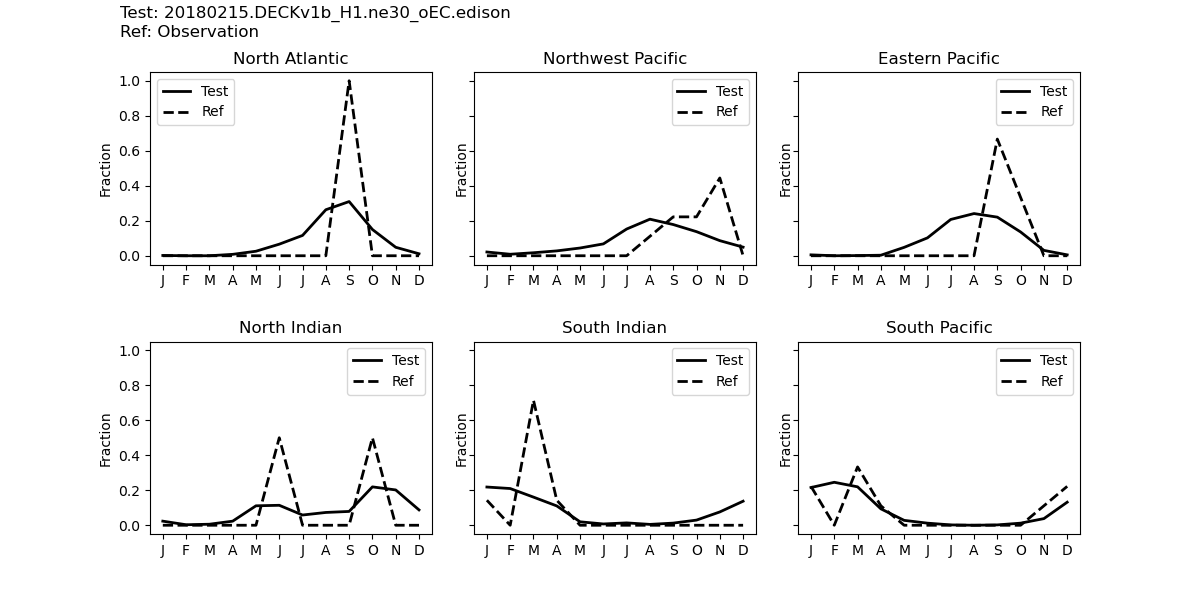
Per-basin Tropical Cyclone frac seasonal cycle |
The above plots and more can be found here.
Feature availability for each backend
The table below summarizes current status of features supported by the backend.
Plot set or Feature |
mpl |
|---|---|
Latitude-longitude contour maps |
✔ |
Polar contour maps |
✔ |
Pressure-latitude zonal mean contour plots |
✔ |
Pressure-longitude meridional mean contour |
✔ |
Zonal mean line plots |
✔ |
Cloud Top Height-Tau joint histograms |
✔ |
Area Mean time series plots |
✔ |
Multi-processing |
✔ |