Available Parameters
The driver needs a parameters file to run. In these files, there is support for many features related to diagnostics.
Given a command like python run_script.py -d param.cfg, the
parameters in run_script.py and in params.cfg will overwrite any predefined values in all runs.
Parameters for diagnostics
The parameters below are ones related to test/reference specifications related to file I/O.
case_id: The name of the folder where the results (plots and nc files) will be stored for a single run. ex:
results_dir/case_iddebug: If
True, stops running all of the diagnostics on the first failure. IfFalse(the default), all errors are caught and ignored. If there was an error and a plot could not be created, there’s a ‘—’ for that set of parameters in the viewer.reference_data_path [REQUIRED]: Path to the reference (obs) data. If there are multiple datasets in the path, use
ref_nameparameter to specify which dataset should be used.ref_name: The particular sub-directory of
reference_data_paththat the reference data is in. Used to locate the reference data. This doesn’t need to be defined if you’re runningmodel_vs_modelormodel_vs_obs. In the built-in parameters files for these, theref_nameis already defined.results_dir [REQUIRED]: The name of the folder where all runs will be stored.
run_type: The supported run type for the diagnostics. Possible options are:
'model_vs_obs'(by default),'model_vs_model', or'obs_vs_obs'.save_netcdf: Set to
Trueif you want the reference, test, and difference data saved. Default isFalse.no_viewer: Set to
Trueto not generate a Viewer for the results. DefaultFalse.test_data_path [REQUIRED]: Path to the test (model) data.
test_name: The name of the test (model output) file. It should be a string matches the model output name, for example
'20161118.beta0.FC5COSP.ne30_ne30.edison'.
These variables are used for handling timeseries data.
ref_end_yr: The end year for the reference data.
ref_start_yr: The start year for the reference data.
ref_timeseries_input: Set to
Trueif therefdata is in timeseries format. DefaultFalse. IfTrue, bothref_start_yrandref_end_yrmust also be set.test_end_yr: The end year for the test data.
test_start_yr: The start year for the test data.
test_timeseries_input: Set to
Trueif thetestdata is in timeseries format. DefaultFalse. IfTrue, bothtest_start_yrandtest_end_yrmust also be set.
The parameters below are for running the diagnostics in parallel using multiprocessing or distributedly.
distributed: Set to
Trueto run the diagnostics distributedly. It’sFalseby default.multiprocessinganddistributedcannot both be set toTrue. A Dask cluster needs to be up and running. You’ll probably never use this.multiprocessing: Set to
Trueto use multiprocessing. It’sFalseby default.multiprocessinganddistributedcannot both be set toTrue.num_workers: Used to define the number of processes to use with either
multiprocessingordistributed. If not defined, it is defaulted to4. Ex:num_workers = 8
The parameters below are related to the actual climate-related functionality of the diagnostics.
plevs: A list of pressure levels to use. Ex:
plevs=[850.0, 200.0].regions: A list of regions. Default is
['global']. See default_regions.py for a list of possible regions. Ex:regions=["global", "TROPICS"].regrid_method: What regird method of the regrid tool to use. Possible values are
'linear'or'conservative'. Default is'conservative'. Read the CDMS documentation for more information.regrid_tool: The regrid tool to use. Default is
'esmf'.seasons: A list of season to use. Default is annual and all seasons:
['ANN', 'DJF', 'MAM', 'JJA', 'SON'].sets: A list of the sets to be run. Default is all sets:
['zonal_mean_xy', 'zonal_mean_2d', 'meridional_mean_2d', 'lat_lon', 'polar', 'area_mean_time_series', 'cosp_histogram', 'enso_diags', 'qbo', 'streamflow','diurnal_cycle'].variables: What variable(s) to use for this run. Ex:
variables=["T", "PRECT"].
Parameters for plotting
The figure below is an sample output. We use this to described what each plotting parameter does.
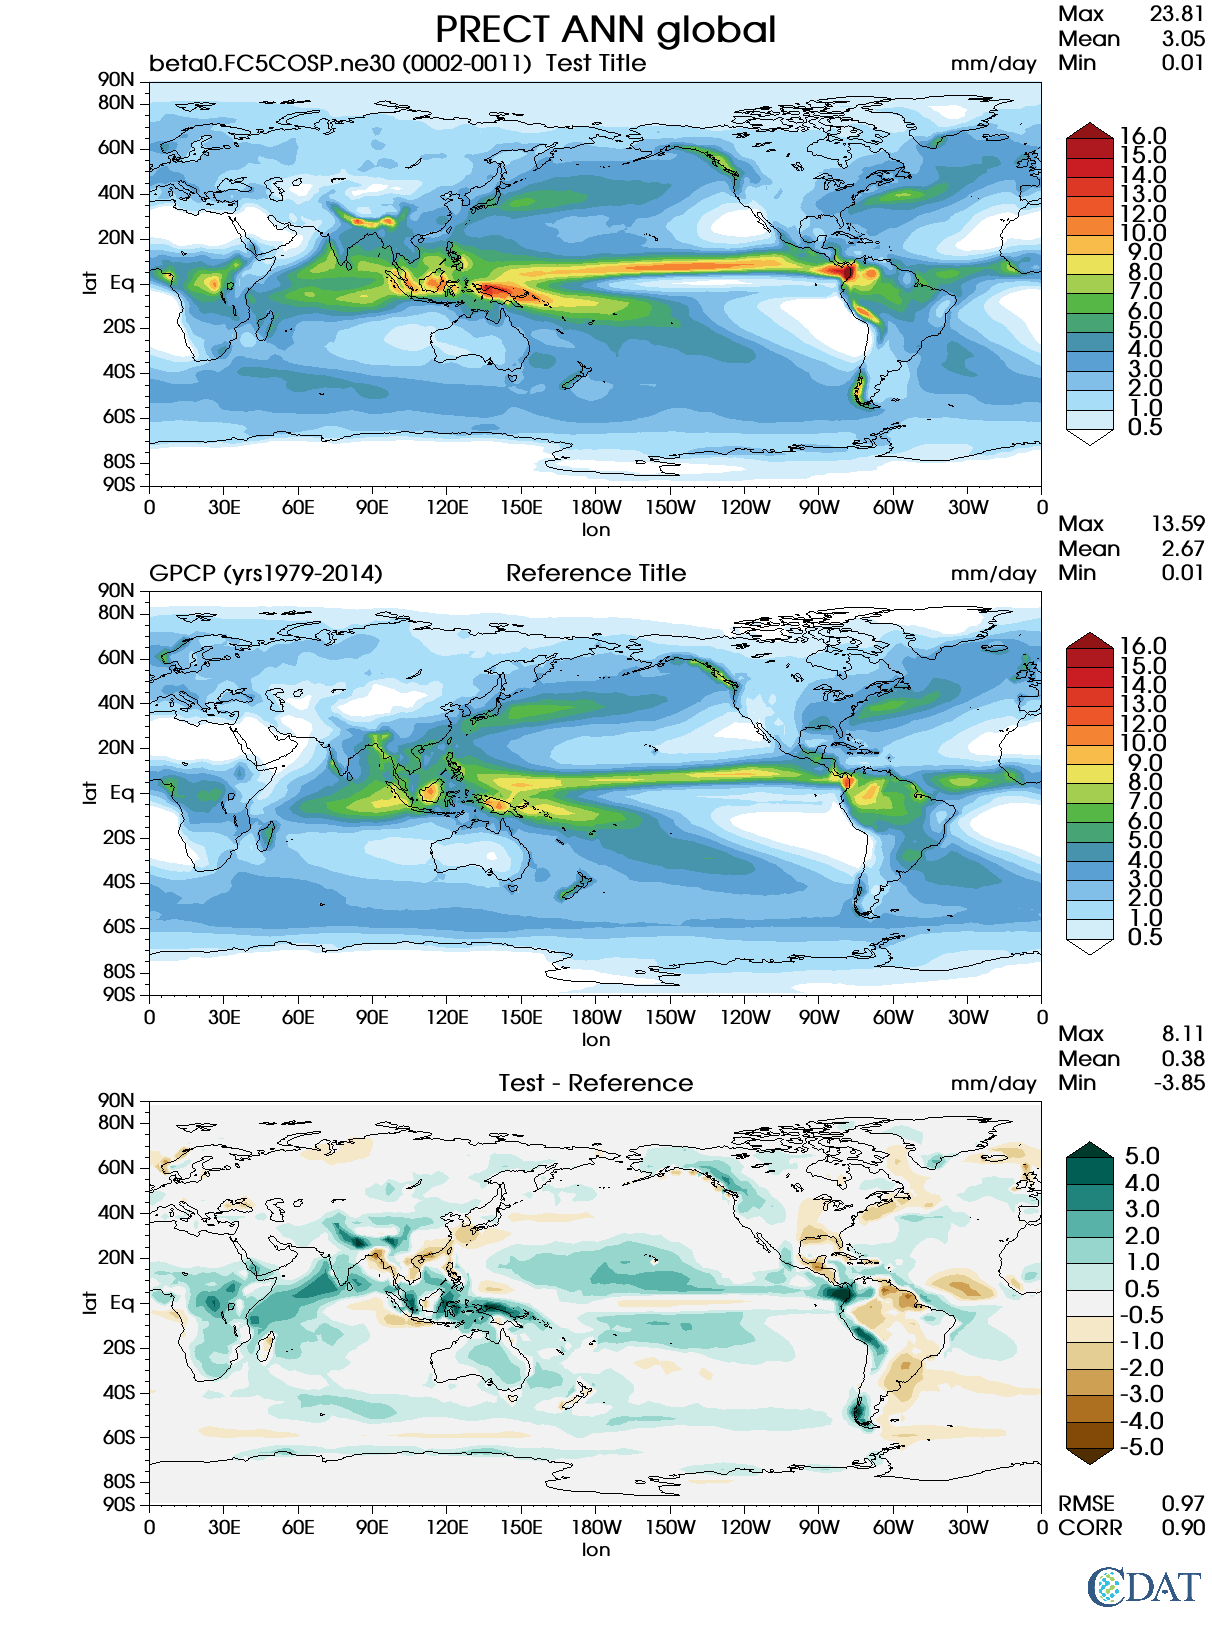
An example plot created from the software
Below are general plotting-related parameters.
arrows: Is either
True(default value) orFalseand will accordingly show or hide the arrows on the legend for all of the graphs.backend: May be set to
'cartopy'or'mpl'(the default) or'matplotlib', all of which result in the Matplotlib/Cartopy backend being used.contour_levels: The levels on the legend of the test and reference plot. It’s
[0.5, 1, 2, 3, 4, 5, 6, 7, 8, 9, 10, 12, 13, 14,
15, 16]
in the image. Default is[].dpi: Figure resolution for Matplotlib. Default is
150.figsize: Figure size (WxH, inches) for Matplolib figures. Default is
[8.5, 11.0].main_title: Main title of the image. It’s
"PRECT ANN global"in this example, which is automatically generated by E3SM Diagnostics. You can definemain_titleto change this.output_format: A list of formats that you want the plot to be output to. Can be something like
['png', 'pdf', 'svg'].Default is['png'].output_format_subplot: File format to save figures for individual panel plots. If not defined or
[](the default), no plots are saved. Possible values are['png', 'pdf', 'svg'].plot_log_plevs: For the
'zonal_mean_2d'and'meridional_mean_2d'sets, log-scale the y-axis.plot_plevs: For the
'zonal_mean_2d'and'meridional_mean_2d'sets, plot the pressure levels.
The parameters below are for each of the three plots (test,
reference, and diff) in the image.
short_test_name: an optional short name that users specify to be shown on the diagnostics figure. It’s
'beta0.FC5COSP.ne30'in the example figure. If not specified, the value in thetest_nameparameter will be shown.test_colormap: If not defined in the parameters, the default value is
'cet_rainbow.rgb'. It’s'WhiteBlueGreenYellowRed.rgb'in the image above. Matplotlib colormaps are supported. Users can even use colormaps located in e3sm_diags/plot/colormaps, by referencing them by the filename (ex:'cet_rainbow.rgb'). Also, setting path to a custom.rgbfile is supported.test_name: Optional text to be specified by the users to be printed upper left above the test figure.
test_title: The title for the test plot. It’s
"Test Title"in the image (upper central texts above the test (model) figure) and is blank by default.test_units: The units that are on the top-right of the test plot. It’s
"mm/day"in the image. If not defined, it automatically gets the units from the test data.
The reference and diff plots also have the same keywords which
are semantically the same for their respective plots. Below are the
values they hold for the image above.
Reference:
reference_colormap: If not defined in the parameters, the default value is
'cet_rainbow.rgb'. It’s'WhiteBlueGreenYellowRed.rgb'in the image above. Matplotlib colormaps are supported. Users can even use colormaps located ine3sm_diags/plot/colormaps/, by referencing them by the filename (ex:'cet_rainbow.rgb'). Also, setting paths to a custom.rgbfile is supported.reference_name: Optional text to be specified by the users to be printed upper left above the ref figure.
reference_title:
"Reference Title"in the image (upper central texts above the reference (obs) figure) and is blank by default.reference_units:
"mm/day"in the image. If blank, it automatically gets the units from the reference data.short_ref_name: an optional short name that users specify to be shown on the diagnostics figure. It’s
'GPCP'in the example figure. If not specified, the value in thereference_nameparameter will be shown.
Diff:
diff_colormap: Is
'BrBG'in the image above and'diverging_bwr.rgb'by default. Matplotlib colormaps are supported. Users can even use colormaps located ine3sm_diags/plot/colormaps/, by referencing them by the filename (ex:'cet_rainbow.rgb'). Also, paths to a custom.rgbfile is supported.diff_name: Optional text to be specified by the users to be printed upper left above the diff figure.
diff_levels:
[-5, -4, -3, -2, -1, -0.5, 0.5, 1, 2, 3, 4, 5]in the image. Default is[].diff_title:
"Test - Reference"in the image (upper central texts above the diff figure). If blank, the default is'Model - Observation'.diff_units:
"mm/day"in the image. If blank, it automatically gets the units from the test - reference data.
Set-specific parameters
Several Diagnostics sets have their own set-specific parameters.
'area_mean_time_series':
end_yr [REQUIRED]: The end year for the data.
ref_names: Used to specify reference data.
ref_timeseries_input: Set to
Trueif therefdata is in timeseries format. DefaultTrue.start_yr [REQUIRED]: The start year for the data.
test_timeseries_input: Set to
Trueif thetestdata is in timeseries format. DefaultTrue.
'diurnal_cycle':
normalize_test_amp: Normalize the test and ref amplitude.
print_statements: Print debugging statements. Default
False.ref_timeseries_input: Set to
Trueif therefdata is in timeseries format. DefaultFalse.test_timeseries_input: Set to
Trueif thetestdata is in timeseries format. DefaultFalse.
'enso_diags':
end_yr: The end year for the data.
nino_region: The NINO region to use. May be
'NINO3', or'NINO34'(the default) or'NINO4'.plot_type: The plot type. May be
map(the default) orscatter.print_statements: Print debugging statements. Default
False.ref_end_yr: The end year for the reference data.
ref_start_yr: The start year for the reference data.
ref_timeseries_input: Set to
Trueif therefdata is in timeseries format. DefaultTrue.start_yr: The start year for the data.
test_end_yr: The end year for the test data.
test_start_yr: The start year for the test data.
test_timeseries_input: Set to
Trueif thetestdata is in timeseries format. DefaultTrue.
You can specify both test_start_yr and ref_start_yr or just start_yr.
You can specify both test_end_yr and ref_end_yr or just end_yr.
'meridional_mean_2d':
plevs: Pressure levels. Default is
numpy.logspace(2.0, 3.0, num=17).tolist().plot_log_plevs: Log-scale the y-axis. Default
False.plot_plevs: Plot the pressure levels. Default
False.
'qbo':
end_yr: The end year for the data.
print_statements: Print debugging statements. Default
False.ref_end_yr: The end year for the reference data.
ref_start_yr: The start year for the reference data.
ref_timeseries_input: Set to
Trueif therefdata is in timeseries format. DefaultTrue.start_yr: The start year for the data.
test_end_yr: The end year for the test data.
test_start_yr: The start year for the test data.
test_timeseries_input: Set to
Trueif thetestdata is in timeseries format. DefaultTrue.
You can specify both test_start_yr and ref_start_yr or just start_yr.
You can specify both test_end_yr and ref_end_yr or just end_yr.
'streamflow':
end_yr: The end year for the data.
gauges_path: Specify the path to the streamflow gauge data. Required if
run_typeismodel_vs_model.main_title_annual_map: The title of the annual streamflow map. Default
'Mean Annual Streamflow Map'.main_title_annual_scatter: The title of the annual streamflow scatter plot. Default
'Mean Annual Streamflow Scatter Plot'.main_title_seasonality_map: The title of the seasonality map. Default
'Seasonality Map'.max_num_gauges: Only process the first
max_num_gaugesgauges – useful for debugging. WhenNone(the default), all gauges are processed.output_file_annual_map: The file name of the annual streamflow map. Default
'annual_map'.output_file_annual_scatter: The file name of the annual streamflow scatter plot. Default
'annual_scatter'.output_file_seasonality_map: The file name of the seasonality map. Default
'seasonality_map'.print_statements: Print debugging statements. Default
False.ref_end_yr: The end year for the reference data.
ref_start_yr: The start year for the reference data.
ref_timeseries_input: Set to
Trueif therefdata is in timeseries format. DefaultTrue.start_yr: The start year for the data.
test_end_yr: The end year for the test data.
test_start_yr: The start year for the test data.
test_timeseries_input: Set to
Trueif thetestdata is in timeseries format. DefaultTrue.
You can specify both test_start_yr and ref_start_yr or just start_yr.
You can specify both test_end_yr and ref_end_yr or just end_yr.
'zonal_mean_2d':
plevs: Pressure levels. Default is
numpy.logspace(2.0, 3.0, num=17).tolist().plot_log_plevs: Log-scale the y-axis. Default
False.plot_plevs: Plot the pressure levels. Default
False.
Other parameters
dataset: Default is
''.granulate: Default is
['variables', 'seasons', 'plevs', 'regions'].selectors: Default is
['sets', 'seasons']. See Using the selectors parameter.viewer_descr: Used to specify values in the viewer. Default
{}.fail_on_incomplete: Exit status will reflect failure if any parameter fails to complete. Default is
False(e.g., a failing parameter will not create a failing exit code).
Deprecated parameters
canvas_size_h: Height of the image in pixels and only used by vcs. Is
1628by default.canvas_size_w: Width of the image in pixels and only used by vcs. Is
1212by default.logo:
True(default value) to show the UV-CDAT logo on the vcs backend,Falseto not. Just keep it on please.